


284# ISAKAS CS Trading System
Submit by Joy22 12/01/2012
Time Frame 4H or Daily
Currency Pairs:all
Indicators:
NonLagMA 40 filter 0.5
MACD (12,26,9)
ENTRY RULES
Long Entry
Enter a LONG position when all following conditions are met
- NonLagMA is GREEN and pointing up
- MACD has the GREEN line cuts above the MAGENTA line
Stop loss
Stop loss is set at 50-70 pip on 4-H timeframe or 90-120 pips on Daily timeframe
Exit
Exit LONG position when either the NonLagMa changes its color or MACD
Indicator has the green line cuts below the magenta line
Short Entry
Enter a SHORT position when all following conditions are met
- NonLagMa indicator is GREEN and pointing up
- MACD Indicator has the GREEN line cuts below the MAGENTA line
Stop loss
Stop loss is set at 50-70 pip on 4-H timeframe or 90-120 pips on Daily timeframe
Exit
Exit LONG position when either the NonLagMa changes its color or MACD
Indicator has the green line cuts above the magenta line
Submit by Konker ( Written by K.Osentogg)13/01/2012
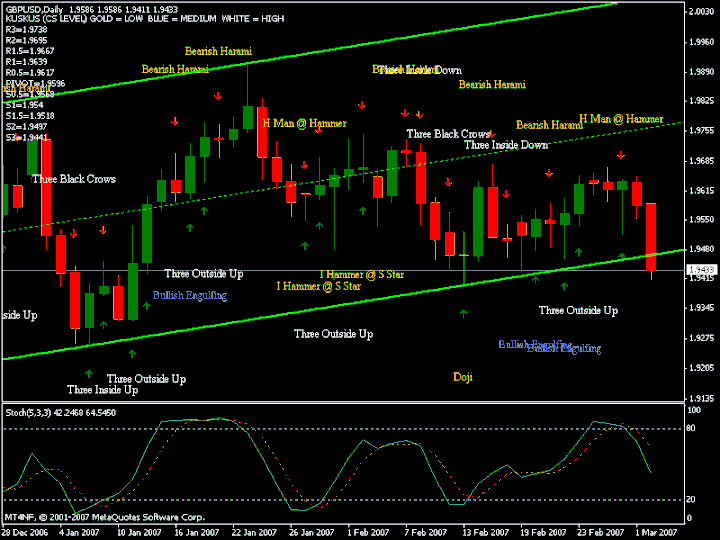
BEARISH & BULLISH ENGULFING
THREE WHITE SOLDIERS & THREE BLACK CROWS
PIERCING LINE & DARK CLOUD COVER
THREE OUTSIDE DOWN & THREE INSIDE DOWN
THREE OUTSIDE UP & THREE INSIDE UP
EVENING & MORNING STAR
BEARISH & BULLISH HARAMI
INVERTED HAMMER & SHOOTING STAR
HANGING MAN & HAMMER
Hi Traders….
I had started to play and seacrhing something interesting method or system for the larger timeframe especially the simple and easily to used.. Then, with my little knowledge about the CANDLESTICK and passions about this JAPANESE tools, i started to find the candlestick indicator ( thanks to Jason robinson ) which then will made us easily to recognize about the type of the candlestick pattern and modified thats becomes more interesting to understand 2 month exploring and searching, 2 Weeks ago just have started for practicing trading. 2 weeks going live with combination entries of ISAKAS ASHI ( AWESOME RESULT ). Meet the famous type of JUJI, TOHBA, TSUTSUMI, KARAKASA, KABUSE, KIRIKUMI and many more famous great names...
Hm...lets get started... First, this method mainly for Tf4hours and Daily timeframe. Based on candlestick formation ( reversal pattern )auto channel and pivot support resistance. For additional indicator, trader also can using RSI or STocH for identifying the strength of reversal Candlestick formation.
TIMEFRAME
4HOURS AND DAILY
INDICATOR
PATTERN RECOGNITION
PIVOT POINT
SHI CHANNEL
STOCH ( 5,3,3 )
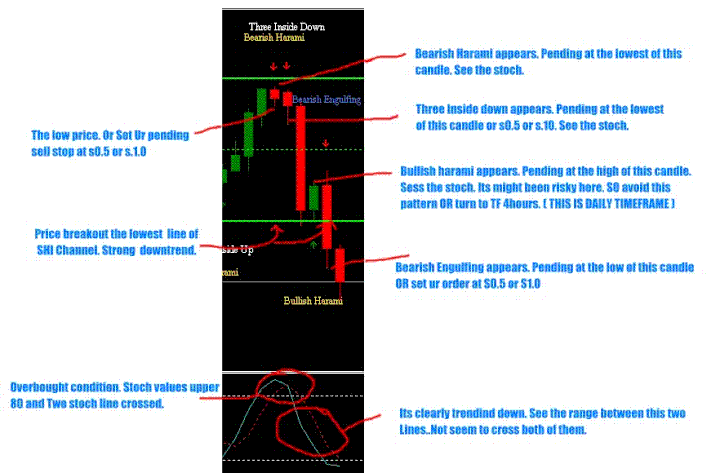
PRIMARY ENTRY - ONLY IF THE PATTERN NAMES SHOW UP UPPER OR LOWER OF THE CANDLESTICK
BUY
SET PENDING ORDER ( BUY STOP ) AT THE HIGH PRICE OF THE PREVIOUSLY CANDLESTICK AND IF THERE IS NO UPPER SHADOW APPEARS, SET ORDERS ON R0.5 OR R1 PIVOT LINES. ( DEPENDS ON RANGE )
SELL
SET PENDING ORDER ( SELL STOP ) AT THE LOW PRICE OF THE PREVIOUSLY CANDLESTICK AND IF THERE IS NO LOWER SHADOW APPEARS, SET ORDERS ON S0.5 OR S1 PIVOT LINES. ( DEPENDS ON RANGE )
IF THE PREVIOUS CANDLE TOO HIGH OR LOW ( MEANS TOO LONG SHADOW OCCURED AND JUST SHOWED A SMALL BODY ) JUST REFERS TO THE PIVOT LINES.
IF THE DAILY TIMEFRAME NOT SEEM TO SHOWED ANY PATTERN, CHANGED THAT TO 4HOURS TIMEFRAME.
TAKE PROFIT OR EXIT TARGET
MINIMUM - 15- 30 PIPS
MAXIMUM – 30 or the last line of pivot point lines ( S3 or R3 )
STOP LOSS
MOST RECOMMENDED UPPER 40 PIPS OR DEPENDS ON YOU.
STOCH AND SHI_CHANNEL
Stoch mostly used for identify oversold and overbought condition technically. If the value of stoch ^ 80 and at the same times, candlestick reversal patterns appears, it’s a good condition and TOP potential of strength for the price directly changed the trend.
Breakout the range ( Upper and Lower line) of this auto channel means the real trend is changing to other direction. This channel line also can be the support & resistance. See the candlestick pattern with confirmation of Stoch to see the strength of reversal or the strength the price will continued the trend. If the price brokes the upper or lower line, it’s a good sign to hold ur postion for a good value of PIPS
SHOOTING STAR & INVERTED HAMMER
HANGING MAN & HAMMER
Four of them also can be called as GOHAN & RAISU means the shapes or patterns of the candlestick is still the same but happened on different situation. Whether reversal on the uptrend or downtrend movement..
There is a lots more type of candlestick pattern, baby swallow, kicking, tasuki and others continous pattern.. Its need more space on the chart ...but..lets started with this candlestick formation first, for begans our introducing of this method. Lets improved this method together. Sharing ur idea and strategy here..
IF ARROWS OR NAMES OF THE CANDLESTICK PATTERN IS GONE OR SCATTERED, PLEASE RESTART UR META CHART.
USING THIS COMBINATION WITH ISAKAS ASHI
Lets said, GU Daily OR TF4hour CANDLESTICK SHOWING BEARISH HARAMI formation. Then.just find for the best ent ry on TF 15 and set ur target. Ur are going with the trend..Lets set the larger TP ( exit target ).. Lets said 2 level of pivot lines ( price now on r1 .. Target r3 ) or just set 30 pips..
ILLUSTRATION
172# ISAKAS Rebirth - Forex Strategies - Forex Resources - Forex
157# Rubicon Strategy - Forex Strategies - Forex Resources -
193# Gurusomu system - Forex Strategies - Forex Resources ...
290# Sar Supertrend - Forex Strategies - Forex Resources - Forex
199# Market is Dead Scalper MDS - Forex Strategies - Forex ...
252# Din V.3 - Forex Strategies - Forex Resources - Forex Trading
162# Trading System, SEFC Palato
205# Scalping with TDI, Real MACD, StochRainbow
154# 15 min Strategy - Forex Strategies - Forex Resources - Forex
182# JumScalping - Forex Strategies - Forex Resources - Forex ...
216# Forex Miko Parabolic System
186# Hakeem's forex Intraday Method

Write a comment