


186# Special Algo: Scalping Strategy on TradingView
Special Algo Strategy with EMA, Cloud and SAR – Trend + Reversal Entries on TradingView”
Dimitri and Maximo Trader 2025 Author Gadi
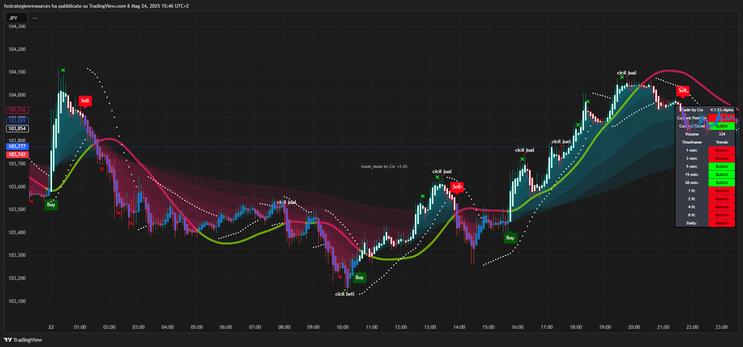
Special Algo: Scalping Strategy on TradingView is a trading system with EMA, Cloud and SAR – Trend + Reversal Entries. This scalping strategy using the Special Algo Indicator by Gadi (, available for TradingView).
It’s a comprehensive non-repainting system that includes:
Buy/Sell labels
A colored EMA to show trend direction
A multi-shade cloud (Kumo-style) to identify market structure
Parabolic SAR to confirm momentum
Visual ❌ markers for profit zones
Optional reversal diamonds (🔷)
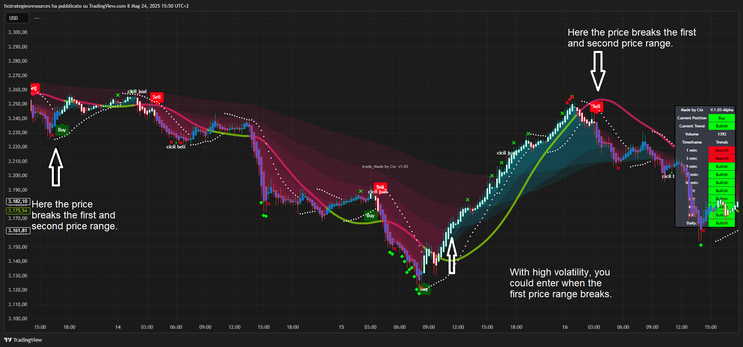
This strategy is ideal for scalping or intraday trading, especially on volatile instruments.
Setup
Platform: TradingView
Indicator: Special Algo v1.03 Alpha by Gadi
Pairs: High-volatility assets (e.g., Gold, GBPJPY, Nasdaq)
Timeframe: 3 minutes or higher (we use 5 min in the demo)
This strategy also works well at high time frames.
Sensitivity:
Set to 5 for 5 min
Lower it (e.g. 2–3) on higher timeframes for smoother signals
Trade Entry Rules
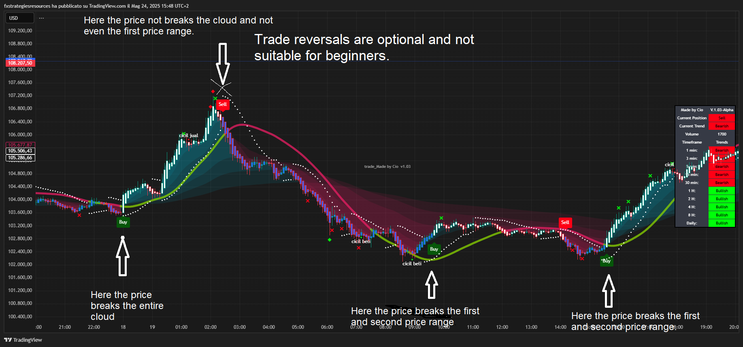
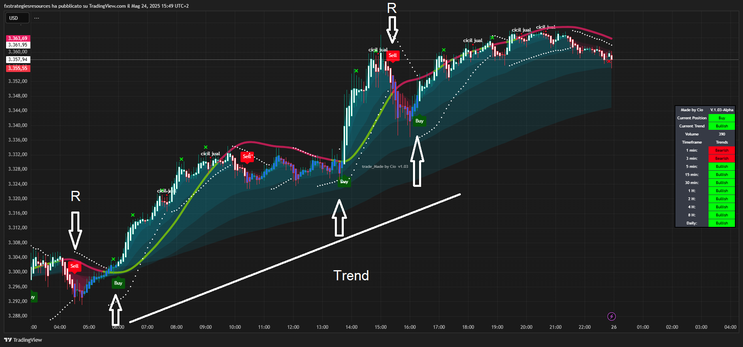
Buy and Sell labels must be confirmed by ALL 3 CONDITIONS below. Buy Setup (Confirmed)
EMA line is GREEN – bullish direction
Cloud is GREEN, and price breaks through the red cloud area and closes above the first green level
Parabolic SAR appears below the candle
A Buy label appears ➜ Enter only if all 3 are true
Stop Loss = below the latest swing low
Exit = when X marker appears (profit target)

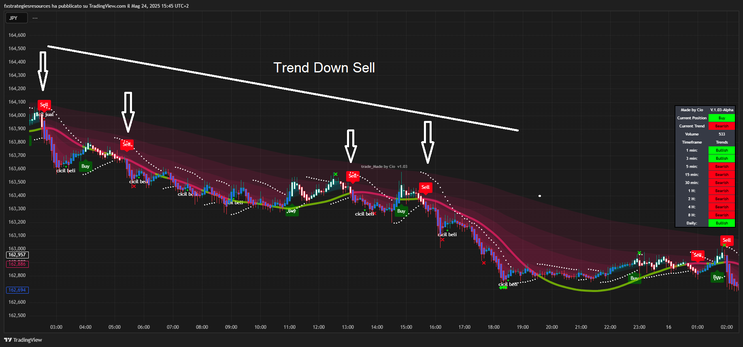
Sell Setup (Confirmed)
EMA line is RED – bearish direction
Cloud is RED, and price breaks below the green zone and closes inside the red cloud
Parabolic SAR appears above the candle
A Sell label appears ➜ Enter only if all 3 are true
SL = above the latest swing high
Exit = when X marker appears
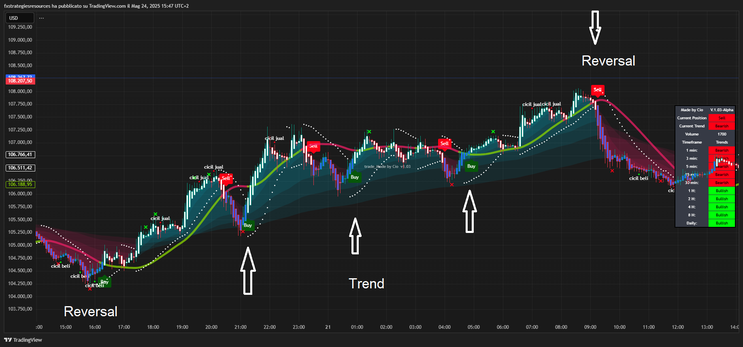
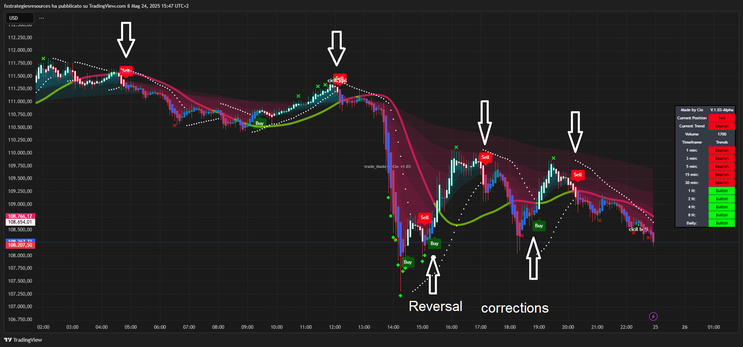
Reversal Trades (Advanced)
Reversal trades are marked by:
💎 Green Diamond = Reversal Buy
💎 Red Diamond = Reversal Sell
These appear in extreme conditions but are only valid if the following apply:
The cloud is being penetrated in the opposite direction
Example: Price breaks above the red cloud for a reversal buy
Or price breaks below the green cloud for a reversal sell
The EMA color begins to shift (neutral or transitioning)
Parabolic SAR flips to support the reversal
These trades signal a potential shift in trend, but they’re riskier and suited for experienced traders.
It should be noted that reversal diamonds are more reliable at higher time frames.

Exit Strategy
The chart will display ❌ X markers once price hits a predefined profit zone
Stop Loss = Previous swing high/low, not ATR
Optional exit: opposite signal with 3 confirmations
Final Thoughts
This strategy is built around clarity, discipline and confluence:
Only act on Buy/Sell labels if:
EMA confirms direction,
Price breaks through and closes inside the cloud
SAR confirms momentum.
SL = previous swing
TP = X on chart
This another great strategy Happy Pips!!

186# FXProsignal Trading System
Submit by Ketang (author SELAMAT BERJAYA)
MEMAHAMI SISTEM fxPro Signal
NAH !!! sekarang tiba masanya untuk anda memulakan trade dengan
menggunakan system fxPro Signal
Saya akan terangkan syarat-syarat dan isyarat yang perlu anda ikut semasa hendak membuat posisi buy atau sell
dengan menggunakan sistem fxPro Signal
MENENTUKAN TREND dan MENGAMBIL POSITION BUY/SELL
1 POSITION SELL
Untuk menentukan trend pair EURUSD , anda perlu memerhatikan time frame 4H, 1H dan 30m.
a. Perhatikan garisan fxPro Signal - Cuba anda perhatikan ketiga-tiga carta 4H, 1H dan 30m semuanya
menunjukan price akan melakukan bearish. Trend ini agak kuat dan menyenangkan anda membuat keputusan untuk position SELL. Mengikut signal semasa.
b. fxPro-TREND - Perhatikan arrow merah dan biru . Arrow merah menunjukan signal SELL dan arroe biru menunjukkan signal SELL. Ketiga-tiga carta terdapat arrow merah yang mengarahkan SELL.
c. fxPro line - pada masa ini TF 30m menunjukkan price berada di upper line. Begitu juga pada TF 4H price
menghampiri upper line. Ini menunjukkan price berada pada paras agak tinggi. Kebarangkalian price
menurun semula adalah besar.
d. MACD. Juga perada pada paras tertinggi.
KEPUTUSAN SELL - BAGAIMANA MELAKUKAN SELL
Pada time frame 30m – anda boleh terus sell atau membuat pending order SELL STOP.
Saya sering
menggunakan pending SELL STOP. Sell Stop dibawah 2 candle sebelum candle semasa dan stop loss di bahagian
atas arrow merah. Take Profit jangan melebihi middle line (profx line). Paling sesuai 30 hingga 50 pips.
3 POSITION BUY
Sekarang mari kita perhatikan rajah di bawah pada pair USDJPY
a. fxPro Signal - ketiga-tiga TF menunjukkan bullish / up trend.
b. fxPro TREND - ketiga-tiga arrow terbaru bewarna biru.
c. FxProline - TF 1H dan 30m berada di lower line.
d. MACD - berada pada paras terndah, kebarangkalian perubahan arah price akan berlaku.
KEPUTUSAN BUY
Pada time frame 30m – anda boleh terus buy atau membuat pending order BUY STOP. Anda boleh
menggunakan pending BUY STOP. BUY STOP diatas 2 candle sebelum candle semasa dan stop loss di bahagian
bawah arrow bitu. Take Profit jangan melebihi middle line (profx line). Paling sesuai 30 hingga 50 pips.
3 JANGAN TRADE JIKA KEADAANNYA BEGINI….
Dalam keadaan begini anda tidak perlu melakukan trading kerana keadaan yang tidak menentu.
Anda tidak dapat menentukan syarat a, b, c dan d . Seperti yang anda lakukan untuk melakukan position buy
dan position sell.
MASA TRADING
Daripada pemerhatian saya, masa yang paling sesuai untuk melihat signal dan memulakan trade menggunakan
sistem fxPro Signal ialah bermula
a. Jam 12 tengahari hingga 2 petang petang.
b. Jam 8mala hingga 10 malam.
c. Jam 12 pagi hingga 2 pagi.
Apa yang penting anda sendiri harus membuat pemerhatian pada graf yang lepas untuk memahirkan
anda memahami graf mengikut masa masa aktif.

ritesh (Tuesday, 27 May 2025)
unable to create the indicator at Trading view
Paresh indravadan Bardolia (Monday, 26 May 2025 17:05)
very nice script.thanks a lot
Czapka (Sunday, 25 May 2025 15:52)
Can you make this strategy on mt4