


205# Fibonacci Progression with Breaks MT5 Strategy
Maximo Trader 2025
Fibonacci Progression with breaks is designed for MT5 indicator to identify high-probability reversal or continuation zones. It leverages Fibonacci levels, breakout confirmations, and dynamic support/resistance for precise entries and exits.
-
Platform: MetaTrader 5 (MT5)
Time Frame: 15-minute or higher (ideal for intraday or swing trading)
Pairs: Any major/minor pairs (recommended: AUD/USD, EUR/USD, GBP/USD)
Indicator: Fibonacci Progression with Breaks
-
Trading Setup
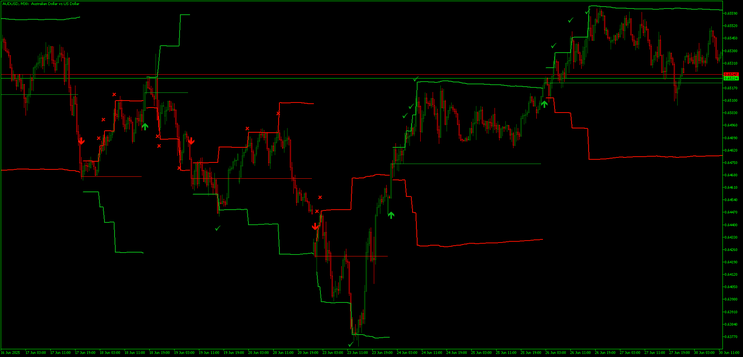
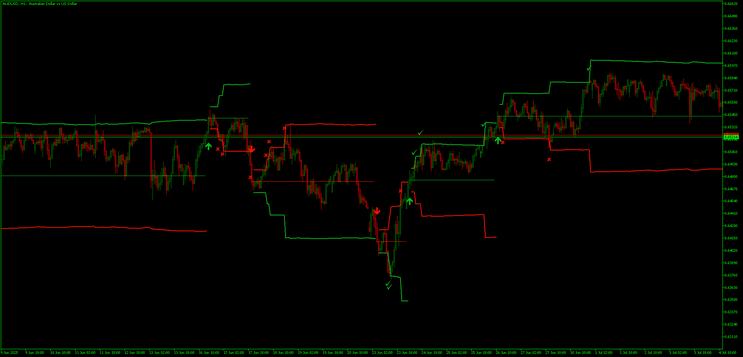
The chart consists of:
-
Fibonacci progression zones (green for bullish, red for bearish)
Breakout confirmation arrows (green up arrows for bullish breaks, red down arrows for bearish)
X marks indicating failed breakouts or fakeouts
Dynamic support/resistance bands (zigzag style)
-
Trading Rules
Buy Entry
-
Breakout Confirmation: Wait for a green arrow (break above a red resistance level).
-
Price Above Green Band: Confirm price is above the green progression band.
-
Retest of Broken Level: Entry on retest of the broken Fibonacci resistance (now turned support).
-
Optional Filter: Look for green check mark near the arrow, indicating confirmation by the system.
Example from Chart
-
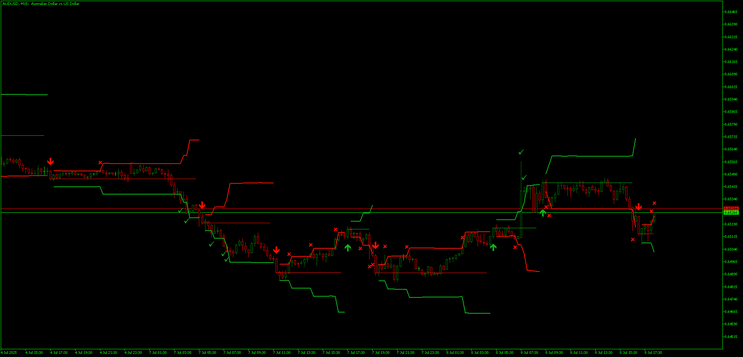
On 8 July around 07:15, green arrow appeared and price broke resistance. Entry was valid after a successful retest.
Sell Entry
-
Breakdown Confirmation: Wait for a red arrow (break below a green support level).
-
Price Below Red Band: Confirm price is below the red progression band.
-
Retest of Broken Level: Entry on retest of broken Fibonacci support (now turned resistance).
-
Optional Filter: Red check mark confirms bearish continuation.
Example from Chart
-
On 4 July 05:30, a red arrow signaled a strong bearish break. Price retested and continued downward.
Exit Rules
Take Profit
-
Primary TP: Next Fibonacci level or opposite progression band
Alternative TP: Risk-to-reward ratio of 1:1.3 minimum
Stop Loss
-
Buy Trades: Below the recent swing low or below green band
Sell Trades: Above the recent swing high or above red band
Conclusion
This strategy aims to ride momentum from confirmed Fibonacci breaks with the help of automated confirmations (arrows and check marks). Avoid trades with an immediate “X” symbol — this usually signals a failed breakout or false signal.
205# SS 2009 Trading System
Trading with SS 2009 ondicator and Bollinger Bands Stop
Submit by joy22
Time Frame 4H
Currency pairs any
Metatrader Indicators:
SS2009B
SS2009C
Heiken ashi Smoothed
Bollinger bands stop
signal bars
In the pictures below than that,the false signal may happen.See the picture how to place the order. Remind for not to enter the market if the spike ss2009_b wanna change the trend..like from bullish to bearish or other than that.
Share your opinion, can help everyone to understand the forex strategy.
-
#2
Hai Phil what 2 indicator?
-
#1
this is best mt4 system i have seen , i have lost so much money on forex but now i am consistent, placed 2 oter indis on template, i wish i could thank whoever made this
Trading System SS 2009 V.2
295# SEFC Universal V.2 - Forex Strategies - Forex Resources ...
162# Trading System, SEFC Palato - Forex Strategies - Forex ...
161# Trading System, SEFC Palato Formula Universal - Forex ...
294# MaKsiGen - Forex Strategies - Forex Resources - Forex ...
156# FX Engine - Forex Strategies - Forex Resources - Forex ...
151# THV 3 - Forex Strategies - Forex Resources - Forex Trading ...
190# DOLLY + ISAKAS + NINA - Forex Strategies - Forex
265# Alpha Trader V.3.1 - Forex Strategies - Forex Resources ...
232# RP - Forex Strategies - Forex Resources - Forex Trading-free
255# IVT - Forex Strategies - Forex Resources - Forex Trading-free
170# IJO ABANG - Forex Strategies - Forex Resources - Forex ...
189# Primajaya - Forex Strategies - Forex Resources - Forex ...
198# Pink FX - Forex Strategies - Forex Resources - Forex Trading
