


252# Ultra Algo with ATR and Overbought/Oversold Zones
Dimitri 2025
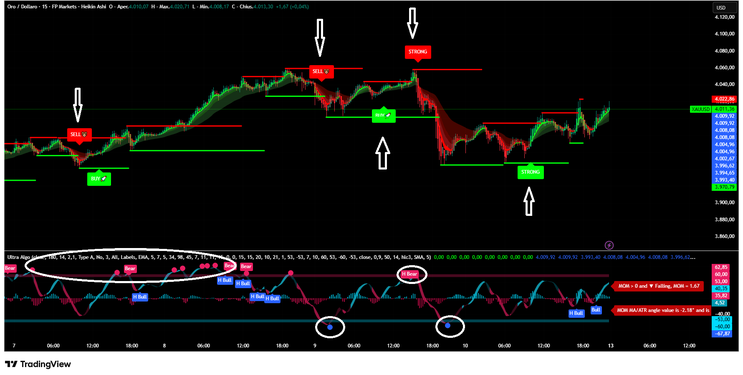
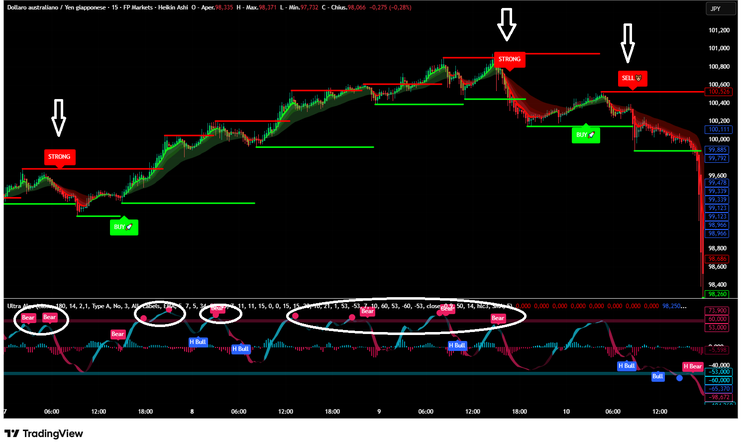
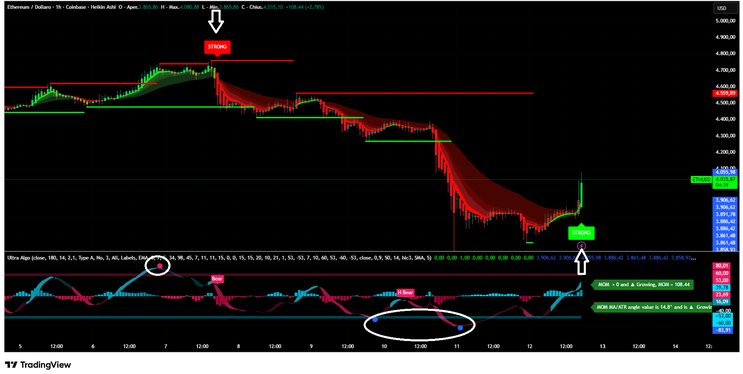
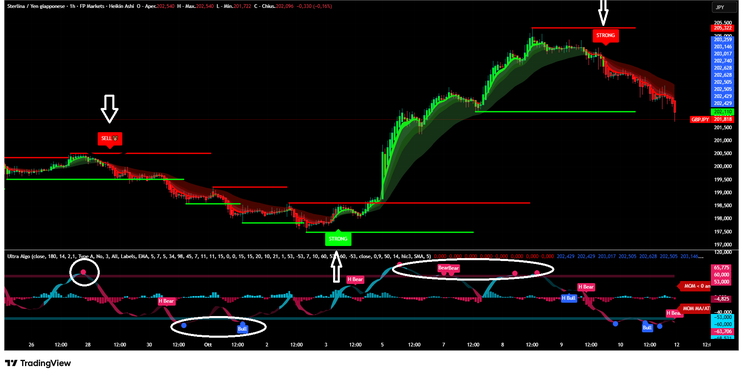
This strategy leverages the Ultra Algo indicator combined with the ATR (Average True Range), using a multiplier of 2.1 to dynamically adjust stop-loss and take-profit levels. The key focus is to identify overbought and oversold conditions, which signal potential market reversals. By following buy and sell signals based on these extreme conditions, traders can enter trades with a favorable risk-to-reward ratio.
Strategy Overview:
-
Time Frame: 15 minutes or higher.
Trading Pairs: Can be applied to any currency pair, with better results on pairs with higher volatility like XAUUSD.
Key Concepts:
-
Overbought/Oversold Zones: These zones are key to the strategy. When the market enters an overbought region, it signals a potential sell. When the market enters an oversold region, it signals a potential buy.
Ultra Algo (ATR 14, Multiplier 2.1): The ATR indicator measures volatility, and the multiplier allows the stop-loss and take-profit levels to adapt to market conditions.
Trading Pairs:
-
Any currency pair (Though this strategy can be applied to different markets, it may work best on pairs with sufficient volatility and liquidity, such as XAUUSD, EURUSD, or GBPUSD).
Indicators Used:
-
Ultra Algo (ATR 14, Multiplier 2.1):
-
ATR (14) is used to calculate the volatility of the asset over the last 14 periods. This helps define potential support and resistance levels based on market volatility.
The Multiplier (2.1) is applied to the ATR value to determine a dynamic range for stop-loss and take-profit settings, adjusting according to volatility.
-
-
Overbought/Oversold Zones:
-
The strategy relies on detecting overbought and oversold levels in the market. When the market is in overbought conditions (price has risen too far or too fast), it is generally a signal to sell. Conversely, when the market is oversold (price has dropped too far or too fast), it's typically a signal to buy.
-
Key Strategy Rules:
-
Buy Signal:
-
Condition: The price enters an oversold zone (below a certain level, as defined by the Ultra Algo’s ATR indicator or price action).
Action: Follow the buy signals given by the Ultra Algo on the chart. These signals will appear as green arrows or labels.
Stop Loss/Take Profit: Use the ATR values to set stop-loss orders dynamically. A common method is to place the stop loss at a multiple of the ATR (e.g., 2.1 times ATR), ensuring that the stop accounts for volatility.
-
-
Sell Signal:
-
Condition: The price enters an overbought zone (price is reaching a peak, and the Ultra Algo signals this with a "SELL" signal).
Action: Follow the sell signals provided by the Ultra Algo on the chart. These signals will typically show up as red arrows or labels indicating "SELL."
Stop Loss/Take Profit: Just like the buy setup, use the ATR-based stop loss and take profit targets. This ensures that the stop loss adapts to market volatility.
-
Understanding the Indicators:
-
Ultra Algo shows you the buy/sell signals based on market conditions.
ATR 14 measures volatility, and the Multiplier (2.1) adjusts for larger price moves, giving you a more flexible approach to setting stops and targets.
The Overbought/Oversold zones help you understand when the market is reaching extreme price levels that are likely to reverse.
How to Implement the Strategy:
-
Set up the chart:
-
Apply the Ultra Algo indicator with the settings: ATR 14, Multiplier 2.1.
Choose a 15-minute time frame or higher for your analysis.
-
-
Watch for signals:
-
Buy Signal: When the price is oversold (as indicated by the Ultra Algo), look for green buy arrows and enter the trade.
Sell Signal: When the price is overbought (as indicated by the Ultra Algo), look for red sell arrows and enter the trade.
-
-
Set stop losses and targets:
-
Use the ATR value to place stops and targets. For example, if the ATR value is 10, you might set your stop loss at 21 pips (2.1 times ATR) away from your entry point.
-
-
Monitor the market:
-
Continuously monitor the Ultra Algo's signals and adjust your trade if necessary.
-
Risk Management:
-
Position Sizing: Consider using a fixed percentage of your account for each trade (e.g., 1-2% of your trading account).
Dynamic Stop Loss: Since the ATR is used to set the stop loss dynamically, you can adjust it based on the volatility of the market.
This strategy aims to take advantage of price extremes, combining volatility measures with overbought/oversold zones for entering and exiting trades. The ATR helps in adapting to different market conditions, making the system more robust and flexible.
252# Din V.3 Trading System
Submit by Janus Trader (Written by Ancoll) 30/11/2011
DIN with TF 30is not too reliable for choopy market and news release, and not so many traders are trading intra day, then I modified DIN indicator to version 3.0 which is using TF 1 hour
Take a look at the picture below (attachment)
Legend:
1. Dolly ver 11 indicator + GMACD + Digistoch
Rule still apply for Dolly indicator, but instead of taking profit 20 pips, you may aim for bigger pips.
2. Isakas Kuskus + fisher
Rule still apply for Isakas, blue is signal for buy, red is signal for sell
3. Nina Indicator (step MA)
If the violet line above the blue line indicates buy, if the violet line below the blue line, indicates sell. For a better confirmation, wait for the violet crossing the blue line and make a blue/ red cross.
4. Bollinger squeeze
Red line means sell signal, blue line means buy signal, while green line means netral (may go long or short if you want)
5. Damiani Signal
Is an indicator to show the noise of the market
TRADE = means you can trade, NO TRADE = nuff said.
6. Waddah Altar Explosion
If the bar = red and above the line = sell signal
If the bar = green and above the line = buy signal
7. Flat trend MACD
Showing the current trend with MACD
Red = sell, blue = buy, yellow = neutral
HOW TO EXIT ?
For stop loss I am using 50 pips, or you may use stop loss according to support or resistance line (fibonanci percent) in dolly ver 11.
To exit, there are many choices:
1. Risk : Reward ratio, if 30 SL then 60TP, if 50 SL then 100 TP
2. You can use the fibonnanci percent or support/ resistance in the first window to take profit
3. Just put 50 pips profit and may use trailing stop 15 pips
4. No exit, leave it open, but use trailing stop 25 pips
5. if by any case, the buy signal alter to sell signal or vice versa then close the trade and take any pips profit.
In the pictures Din V.3 forex system in action.
Din V.1

190# DOLLY + ISAKAS + NINA - Forex Strategies - Forex
284# ISAKAS CS - Forex Strategies - Forex Resources - Forex ...
53# Isakas Sekelper - Forex Strategies - Forex Resources - Forex
172# ISAKAS Rebirth - Forex Strategies - Forex Resources - Forex
173# Trading System, ISAKAS II V.2 - Forex Strategies - Forex ...
171# ISAKAS II - Forex Strategies - Forex Resources - Forex
165# Isakas Osentogg - Forex Strategies - Forex Resources -
335# Dolly 10,11,12 - Forex Strategies - Forex Resources - Forex
190# DOLLY + ISAKAS + NINA - Forex Strategies - Forex
310# Dolly 13 - Forex Strategies - Forex Resources - Forex Trading
257# Dolly 2 - Forex Strategies - Forex Resources - Forex Trading
32# Dolly Modified - Forex Strategies - Forex Resources - Forex ...
318# Ultima Secret V.1 - Forex Strategies - Forex Resources -
339# Gold Miner and Stochbars Strategy - Forex Strategies - Forex
20# Fx Faizumi - Forex Strategies - Forex Resources - Forex
Trading System Metatrader 4 III
