


262# Trendline with Breaks Trading Strategy MT5
Maximo Trader 2025
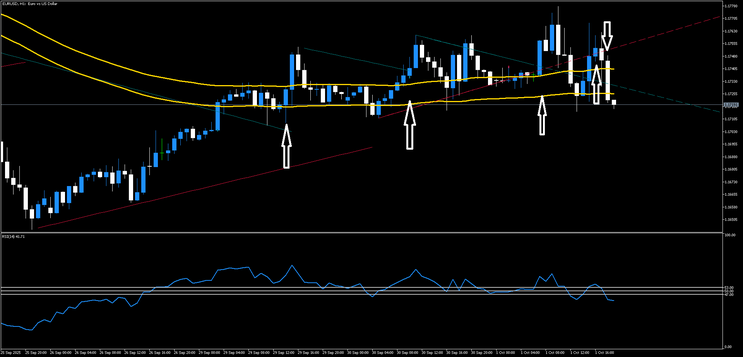
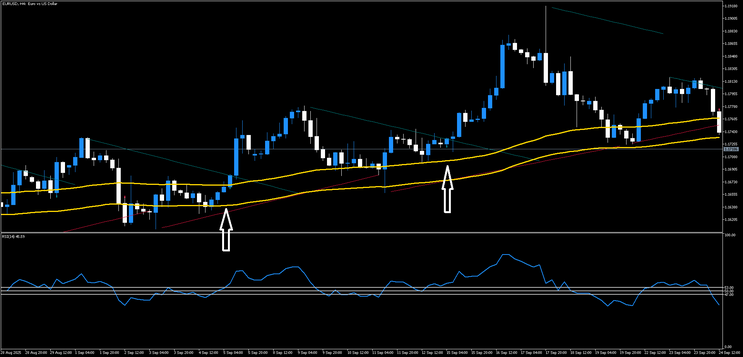
The Trendline with Breaks strategy is a technical trading approach designed for MetaTrader 5 users who prefer rule-based setups. The system combines classical chart analysis with objective filters: trendline breaks, two exponential moving averages (EMA 100 applied to High and Low), and the Relative Strength Index (RSI) with non-standard levels (47 and 53). The goal is to capture genuine momentum after a confirmed breakout while avoiding false signals.
Indicators Used
-
Trendline with Breaks
-
A manually or automatically drawn trendline across significant swing highs (for resistance) or swing lows (for support).
The breakout occurs when the price closes beyond the drawn trendline.
-
-
Exponential Moving Average (EMA 100)
-
EMA 100 High: used as a dynamic resistance filter.
EMA 100 Low: used as a dynamic support filter.
-
-
Relative Strength Index (RSI, period 14)
-
Instead of the classic 30/70 zones, the strategy applies two custom levels: 47 and 53.
RSI above 53 suggests bullish confirmation, while RSI below 47 suggests bearish confirmation.
-
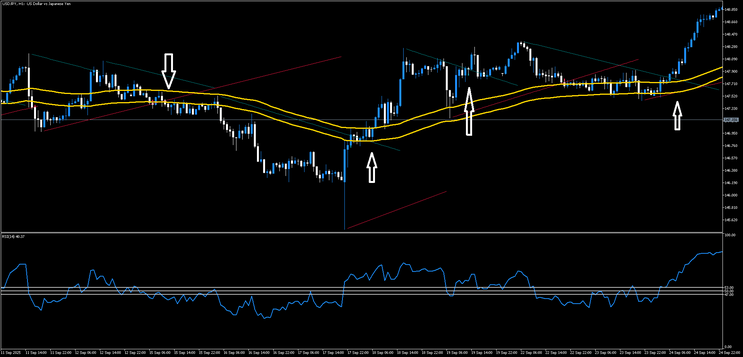
Entry Rules
Long Setup (Buy):
-
Identify a valid upward breakout: the price must close above a descending trendline.
-
Confirm that the closing price is above the EMA 100 (High).
-
RSI must be greater than 53 at the breakout candle.
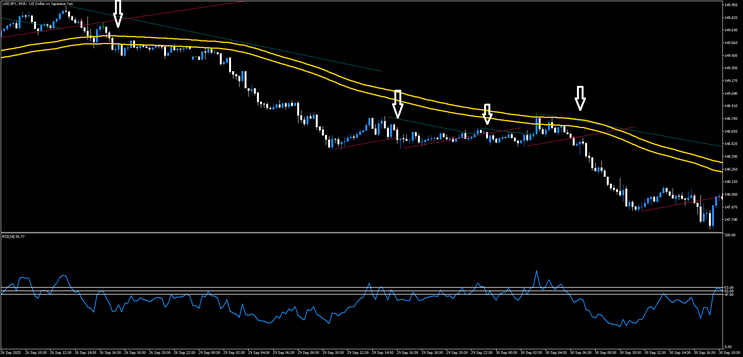
Short Setup (Sell):
-
Identify a valid downward breakout: the price must close below an ascending trendline.
-
Confirm that the closing price is below the EMA 100 (Low).
-
RSI must be less than 47 at the breakout candle.
Exit Rules
-
Stop Loss (SL): place it just beyond the broken trendline or use a fixed distance (e.g., 30–50 pips depending on timeframe).
Take Profit (TP): target at least 1:2 risk-to-reward ratio or use recent support/resistance levels.
Optional Trailing Stop: trail the stop loss after the trade moves in favor by 1R.
Timeframes & Markets
-
Best applied on H1 to H4 charts for clearer trendline structures and fewer false breaks.
Can be used on major Forex pairs, indices, or even commodities like gold, provided liquidity is high.
Advantages
-
Objective + Visual: Combines classical chart trendlines with measurable filters.
False Breakout Filter: EMA and RSI confirmation reduce noise.
Flexibility: Works across multiple asset classes and timeframes.
Limitations
-
Requires patience to wait for a valid breakout and confirmation.
Trendline drawing can be subjective if done manually.
Works best in trending conditions, less effective in ranging markets.
Conclusion
The Trendline with Breaks strategy is a disciplined breakout method that merges traditional charting techniques with quantitative filters. By requiring both EMA alignment and RSI confirmation, traders can avoid many false signals that plague pure trendline trading. While no system is perfect, this approach provides a structured way to trade breakouts with improved accuracy and consistency in MetaTrader 5.
262# Dynamic Meter
Submit by Joker 16/12/2011
Time Frame : any
Currency airs: any
The Dynamic Force Meter shows an ARROW when it generates a
signal. A Green arrow is a long signal, and a Red arrow is a short signal.
This indicator automatically identifies cycles and gets you the most
accurate entry signals that occur before the market started to move:
Stop Loss
For each signal the Dynamic Force Meter automatically calculates stop
loss. You will see the stop loss in the alert the indicator issues.
Exiting Trades
It is recommended to exit the trade as soon as the Dynamic Force Meter


Dynamic Meter not works on all MT4 plataform
-
#2
En que mt4 funciona?
-
#1
which broker can i use for this trade
