


166# Filtered Moving Average: Strategy with Support/Resistance Zones
Janus Trader 2025
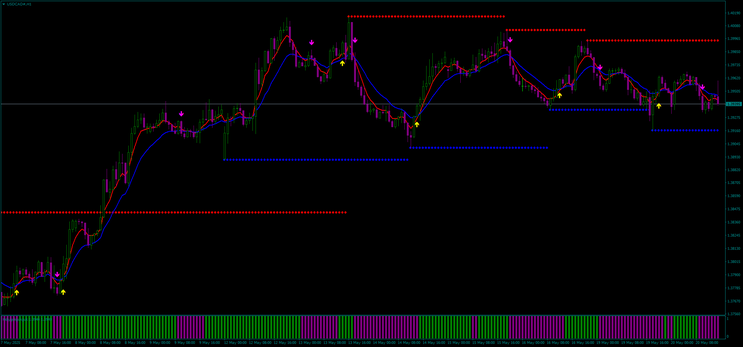
Filtered Moving Average strategy is built around the concept of trend-following entries confirmed by filtered moving average signals, combined with visual dynamic support and resistance levels. It uses a dual moving average histogram to confirm momentum and trend bias. The goal is to identify high-probability entries after pullbacks in the direction of the prevailing trend.
Setup Strategy
Time frame 30 min or higher.
Currency pairs:volatile.
Platform: Metatrader 4
Indicators Used
-
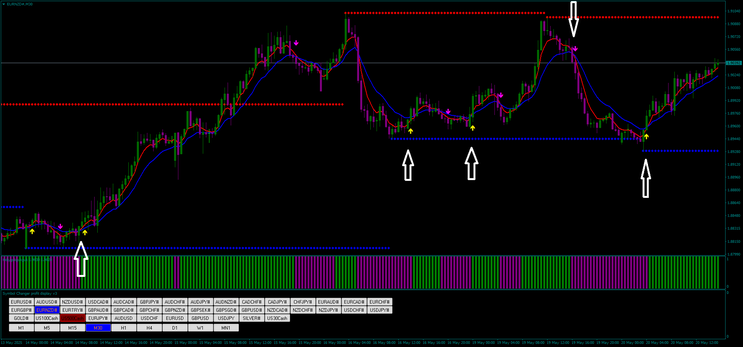
Filtered Moving Average Arrows
-
Yellow Arrows: Bullish filtered moving average cross.
-
Pink Arrows: Bearish filtered moving average cross.
-
-
Dynamic Support/Resistance Levels
-
Red Dots: Resistance zones.
-
Blue Dots: Support zones.
-
-
Moving Average Histogram (Bottom Indicator)
-
Represents the relationship between two moving averages (e.g., 9 EMA and 18 EMA).
-
Green Bars: Bullish momentum (9 EMA above 18 EMA).
-
Magenta Bars: Bearish momentum (9 EMA below 18 EMA).
-
4. Exponential moving Average 5 periods, close.
5.Exponential moving Average 13 periods, close.
BUY Conditions
-
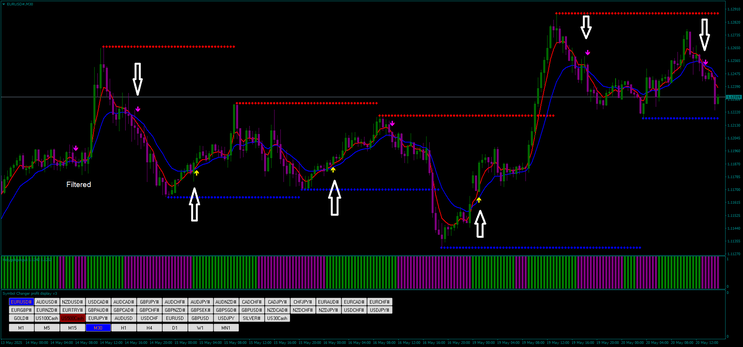
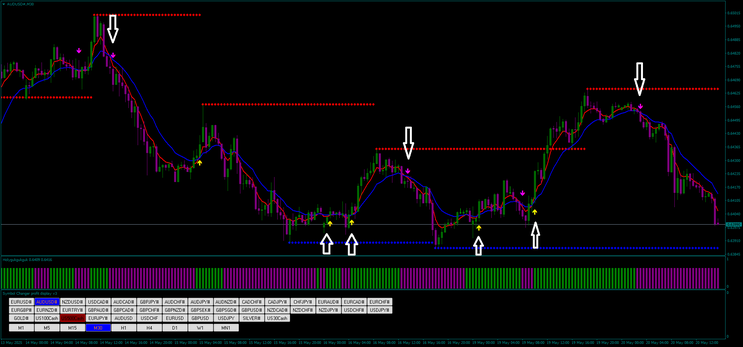
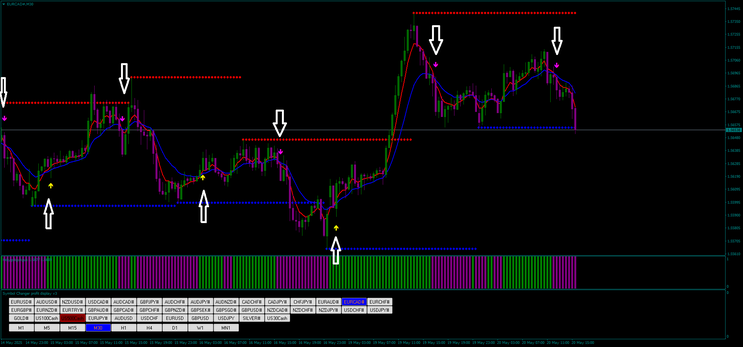
A yellow arrow appears below the price candle, indicating a bullish filtered MA crossover.
-
Price is above a blue support zone or bouncing off it.
-
The histogram bars at the bottom are green, indicating bullish momentum.
-
Ideally, price is also above both the 5 and 13 EMAs. 5 Ema crosses upward 13 EMA.
Entry: Open a long (buy) position at the close of the signal candle.
Stop Loss:
-
Below the recent swing low or
-
Below the nearest blue support level.
Take Profit:
-
At or just below the nearest red resistance level.
-
Alternatively, use a risk/reward ratio of at least 1:1.2.
SELL Conditions
-
A pink arrow appears above the price candle, indicating a bearish filtered MA crossover.
-
Price is below a red resistance zone or rejecting from it.
-
The histogram bars at the bottom are magenta, indicating bearish momentum.
-
Ideally, price is below both the 9 and 18 EMAs.5 Ema crosses upward 13 EMA.
Entry: Open a short (sell) position at the close of the signal candle.
Stop Loss:
-
Above the recent swing high or
-
Above the nearest red resistance level.
Take Profit:
-
At or just above the nearest blue support level.
-
Alternatively, use a risk/reward ratio of at least 1:1.2.
Exit Rules
-
TP or SL hit, or
-
Manual close when a reverse signal arrow appears (e.g., yellow arrow during a short trade).
-
Optionally, trail stop after price moves in your favor by 1x risk.
Conclusion
This strategy combines visual clarity with logical structure: entries are based on filtered moving average signals, supported by directional momentum (histogram), and validated by dynamic support/resistance zones. It filters out low-probability trades and keeps you trading in line with the dominant trend.
This system works best in trending markets and may require additional filters or confirmation tools (e.g., higher timeframe trend direction or price action) in ranging conditions.
122# Superscalper - Forex Strategies - Forex Resources - Forex ...
84# 1 min Scalping III "Profit System"
24# Parabolic Sar Trend Scalper - Forex Strategies - Forex ...
98# AFX Trader - Forex Strategies - Forex Resources - Forex ...
2# Scalp with EmaPredictive - Forex Strategies - Forex Resources
133# 1 min Contrarian Scalping (VIII)
57# Scalping with Money Flow Index and Bollinger Bands
16# Bollinger Bands scalp GBP/JPY - Forex Strategies - Forex ...
104# Vlad System 15 min Day Trading
