


218# ATR Channels Trend Following Strategy -TradingView-
Trending Winning Strategy
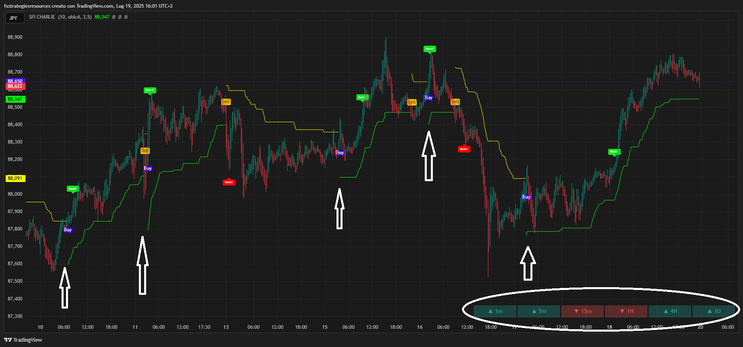
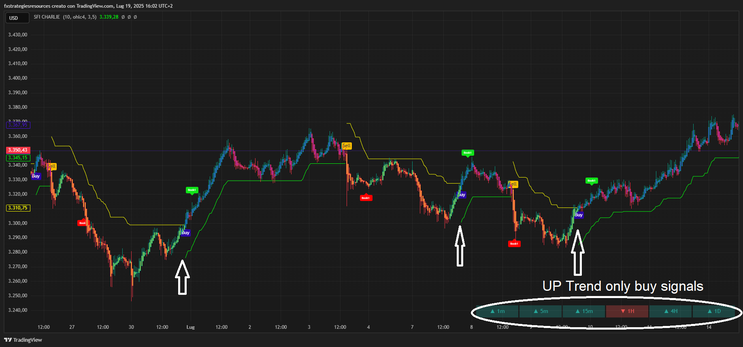
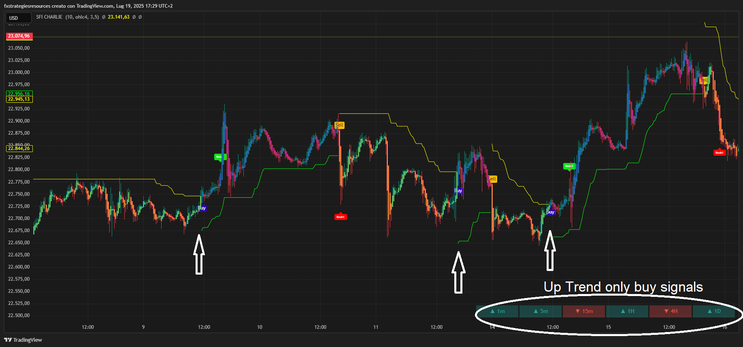
The SFI Charlie Indicator is a trend-based tool that uses ATR (Average True Range) channels, dynamic support/resistance, and momentum confirmation to detect buy/sell opportunities in the market. It visualizes trend direction using colored ATR bands, plots buy/sell signals, and shows multi-timeframe trend alignment through a clean dashboard.
The strategy aims to ride trends while protecting capital using ATR-based risk management and predefined profit-taking levels.
Setup
Timeframes: Works well on 5m, 15m, 1H, and 4H charts.
Assets: Forex, Crypto, Index CFDs (high-volume, trending pairs preferred).
Indicator Components:
ATR Bands (Trend Filter)
Buy/Sell Signals (based on trend reversal)
Color-coded candles
Take-Profit Labels (Book1)
Multi-timeframe Trend Dashboard
Buy Conditions
Enter a Long (Buy) trade when all of the following conditions are met:
1 The Buy Signal label appears (indicator switches from red trend to green).
2 The price is above the ATR band, confirming trend reversal.
3 (Optional) The price is above the moving average filter (if enabled).
4 (Optional) At least 3 out of 6 timeframes on the trend dashboard show “▲” (uptrend).
Sell Conditions
Enter a Short (Sell) trade when all of the following conditions are met:
1 The Sell Signal label appears (indicator switches from green trend to red).
2 The price is below the ATR band, confirming downward pressure.
3 (Optional) The price is below the moving average filter.
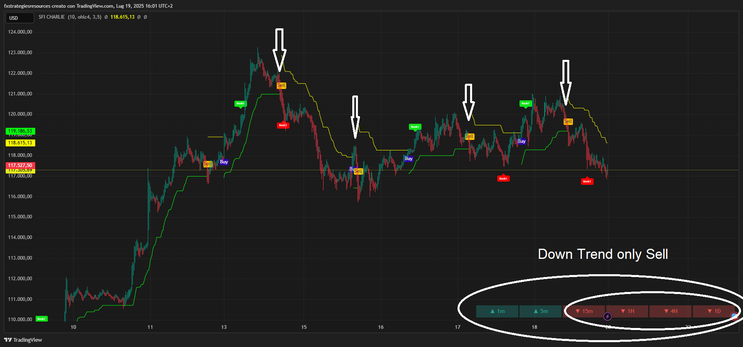
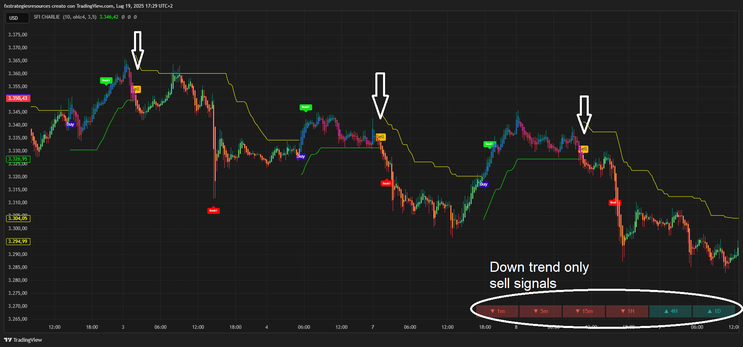
4 (Optional) At least 3 out of 6 timeframes on the dashboard show “▼” (downtrend).
Exit Strategy
Take Profit
Use the indicator's “Book” levelas dynamic profit targets:
Book1: 1
Stop Loss :
Place stop lo on the previous swing high/low.
Additional Notes
Avoid ranging markets — the indicator performs best in trending conditions.
You may use a higher timeframe trend filter (e.g., 1H chart shows uptrend while trading on 15m).
Candle coloring gives a visual cue: deep blue for buys, bright yellow for sells.
Conclusion
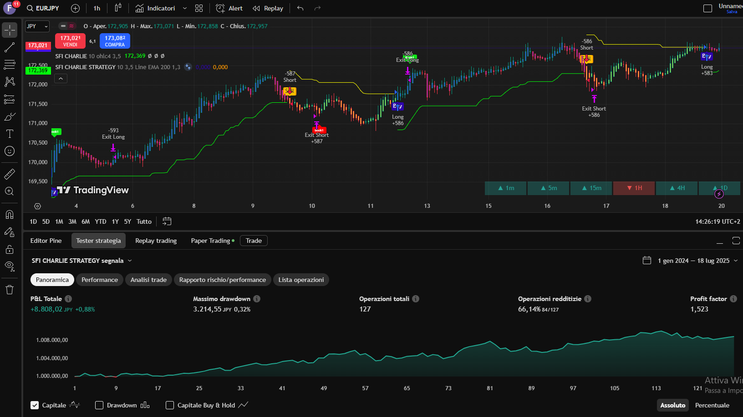
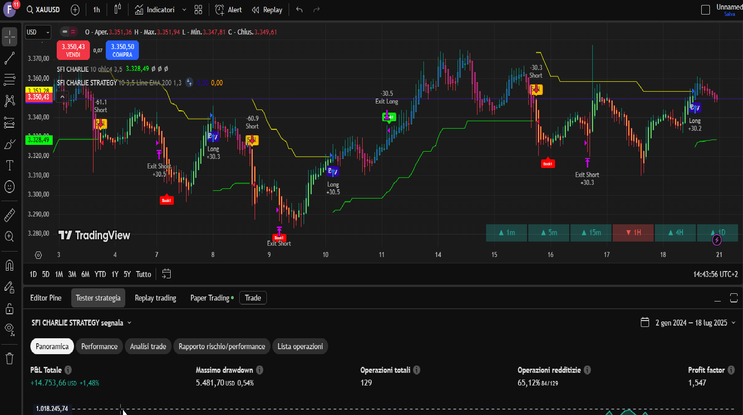
The SFI Charlie Strategy is a powerful tool for visual trend-based trading. With its multi-timeframe awareness, clear entry/exit rules, and ATR-driven risk management, it provides both clarity and confidence.
While no indicator is perfect, combining this with discipline, solid risk management, and a bit of price action awareness can give traders a strong edge in the market.
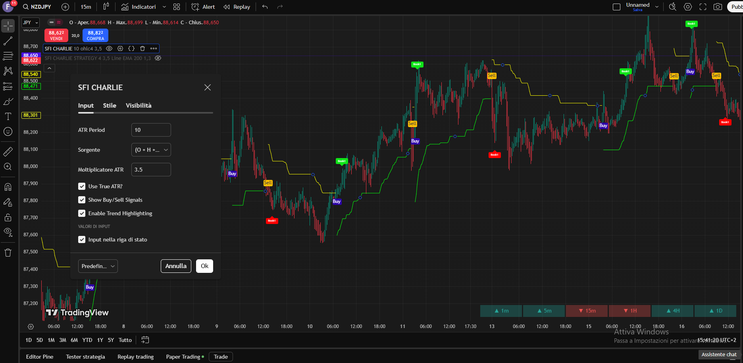
I'll show you the setup along with a strategy created using the same indicator to better configure it and evaluate its performance. If you're interested in this strategy, please email us: fxstrategiesresources@gmail.com for a donation.
218# TG Strategy Trading System
Submit by Joy22
ENTRY RULES
BUY RULES
Open a LONG position when all these conditions are satisfied
- Filter indicator has Blue Line above Red Line
- TR2 Indicator is BLUE
- TG Indicator is BLUE
SELL RULES
Open a SHORT position when all these conditions are satisfied
- Filter indicator has Red Line above Blue Line
- TR2 Indicator is RED
- TG Indicator is RED
Stop loss
The suggested stoploss value for daily timeframe is 100-120 pips and 50-70 pips of used on
4-H timeframe
Exit
There are two ways to exit your trade
- Use take profit level equals or 2 times of stoploss level.
- Exit when there are at least two indicators showing a reversal signal
The recommended timeframes for this system are 4-H and daily
TRADE EXAMPLES
SELL GBP/USD on Daily Timeframe
In the pictures TG Strategy forex system in action.
As we can see from the screenshot above, TR2, TG and Filter indicator all showed a down
signal. So, we had all the setup conditions for a SHORT entry. So on the next candle; we
entered a SHORT position at 1.3220. We used stoploss value of 60 pips . So, the stoploss was
set at 1.3280. The trade went down strongly in our favor direction and when both Filter and
TR2 showed a reversal signal, we exited our trade at 1.2867 with 353 pips in profit
BUY EUR/USD on Daily Timeframe
As we can see from the screenshot above, TR2, TG and Filter indicator all showed a bullish
signal. So, we had all the setup conditions for a LONG entry. So on the next candle; we
entered a LONG position at 1.3306. We used stoploss value of 70 pips . So, the stoploss was
set at 1.3236. The trade went up strongly in our favor direction and when both TG and TR2
showed a reversal signal, we exited our trade at 1.3511 with 205 pips in profit
12# Parabolic and Awesome - Forex Strategies - Forex Resources
114# Awesome and Bollinger Bands Scalping - Forex Strategies ...
75# Awesome, Stochastic and ADX - Forex Strategies - Forex ...
152# Awesome , Accelerator and HMA - Forex Strategies - Forex
18# Stochastic and Awesome - Forex Strategies - Forex
25# ADX, Awesome and Stochastic Histogramm - Forex
30# Stoch, Awesome and Ema - Forex Strategies - Forex
3# Pin Bar and Awesome - Forex Strategies - Forex Resources ...
173# Awesome - Forex Strategies - Forex Resources - Forex ...
83#Awesome and MACD - Forex Strategies - Forex Resources ...
32# AC,AO and Stochastic - Forex Strategies - Forex Resources ...

Brijesh patel (Tuesday, 29 July 2025 20:29)
please provide me this stratagy ,, sfl charlie
my email id... brijeshpatel3292@gmail.com