


155# Opening Range Breakout TradingView Strategy
Joy22 2025
The Opening Range Breakout (ORB) is a classic and powerful strategy used by intraday traders to capitalize on the volatility of the market's early trading hours. In this article, we’ll explore how the Intrablast Indicator automates and enhances this strategy using a sophisticated blend of technical analysis tools, trend confirmation logic, and visual cues to simplify real-time decision-making.
📅 What is the Opening Range?
The Opening Range is defined as the high and low price of an asset during a specific early period of the trading day. For this strategy, the default session is from 09:15 to 10:15 (IST). The idea is simple: once the price breaks out of this range—either above the high or below the low—it can signal a potential trade opportunity in the direction of the breakout.

⚙️ How the Intrablast Indicator Works
The Pine Script provided automates the ORB strategy with several layers of intelligence:
✅ 1. Opening Range Detection
-
Marks the high and low during the defined time range.
-
Plots horizontal lines to represent the range boundaries.
-
Optionally displays a shaded background for visual clarity.
✅ 2. Trend Strength with Standard Deviation Bands
-
A custom trend model based on a simple moving average (SMA) and standard deviation is used to detect strong bullish or bearish momentum.
-
The indicator classifies trends using band breakouts, helping avoid false signals.

✅ 3. Four-Candle Confirmation Logic
-
To improve signal quality, the script uses a unique four-candle breakout confirmation. A Buy/Sell signal is generated only if the price closes above or below the high/low of the previous four bars.
-
This filters out noise and ensures stronger conviction in breakouts.
🔔 Trade Signal Logic
The indicator produces clear Buy ("P-Buy") and Sell ("P-Sell") signals based on:
-
A confirmed trend change (using the SMA-deviation logic).
-
A valid breakout above the high or below the low of the four recent candles.
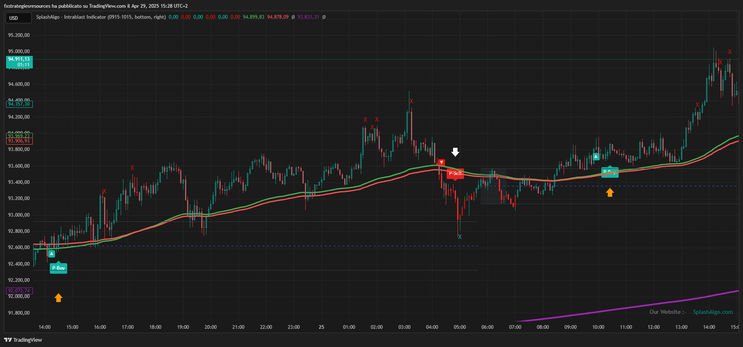
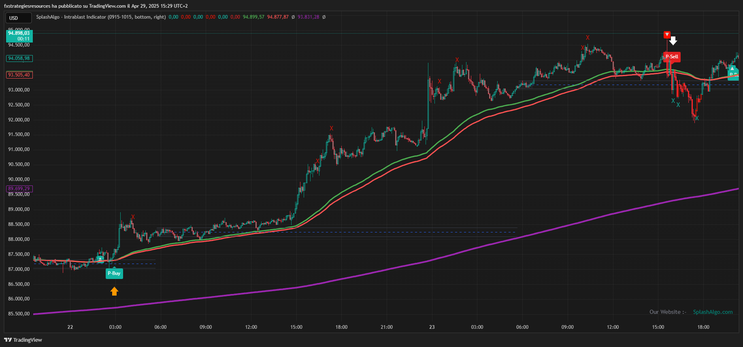
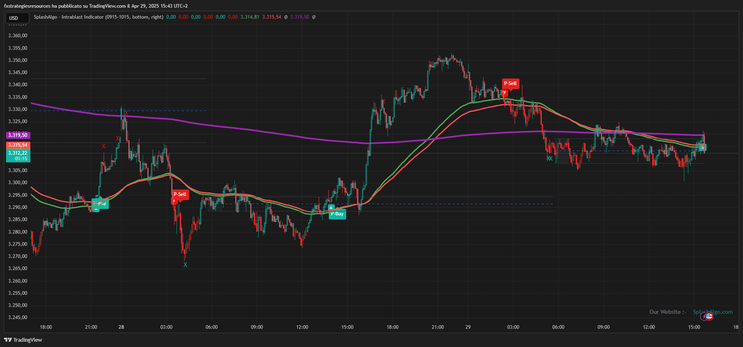
These signals are marked directly on the chart using intuitive labels and symbols, making it easy to execute trades.
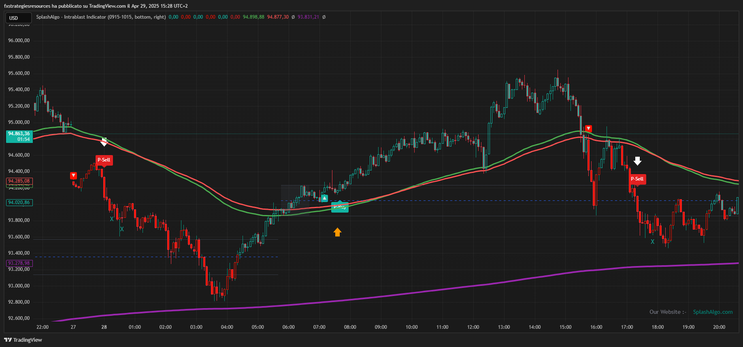
📊 Visual Features and Enhancements
While the underlying logic is robust, the chart visuals help traders quickly interpret signals:
-
Green and Red Bars: Represent bullish and bearish momentum.
-
ORB Box: Shows the initial trading range with optional mid-line and projections.
-
Directional Arrows: Appear when trends change.
-
Take-Profit Markers ("X"): Indicate when price crosses outer deviation bands, acting as potential reversal or target zones.
📈 Asset Coverage
The script is designed to support multiple markets:
-
Indices: NIFTY, BANKNIFTY, FINNIFTY, SENSEX, etc.
-
Cryptocurrencies: BTC/USD, ETH/USD
-
Custom symbols can be added easily via
request.security()for integration with other assets.
📢 Alerts and Automation
The strategy includes real-time alerts:
-
Trend reversal alerts
-
Take-profit level alerts
-
Buy/Sell signal alerts
-
These can be configured to push notifications to your phone, email, or webhook-connected bots.
🧠 Final Thoughts
The Intrablast Indicator takes a traditional trading strategy—the Opening Range Breakout—and enriches it with:
-
Multi-layered trend confirmation,
-
Robust breakout filters,
-
Clean chart visuals,
-
And support for multiple instruments.
For traders looking to systematize their intraday strategy with precision and automation, this tool provides both clarity and edge.
f this strategy helps you, consider supporting the project with a small donation ☕💛:
👉 contact us at fxstrategiesresources@gmail.com
Your support helps me keep improving and sharing more!”
155# EMA CROSS RSI with Digital MACD
Time Frame H1 or Higher best time frame H4
Currency pairs: all
Indicators:
EMA Cross RSI (set True);
Digital MACAD (default).
Long Entry:
EMA Cross RSI buy arrow confirmed by histogram MACD >line.
Short Entry:
EMA Cross RSI sell arrow confirmed by histogram MACD <line.
Exit Position:
Place Stop loss at the previous swing High for sell and low for buy.
Set Profit Target ratio 1.2 (if stop loss is 50 pips, profit target is 100 pips).
Set Trailing 25 pips if in gain of 50 pips (time frame hourly), 100 pips (time Trame 240 min).
In the pictures EMA CROSS RSI with Digital MACD forex system in action.


Share your opinion, can help everyone to understand the forex strategy.
EMA Forex Strategies
25# EMA's Band Scalp - Forex Strategies - Forex Resources -
4# Cross EMA - Forex Strategies - Forex Resources - Forex
84# 5 EMA and 13 EMA Fibonacci Numbers - Forex Strategies ...
40# MACD, RSI, 50 Ema and Pivot Points - Forex Strategies -
35# 100 EMA MultitimeFrame - Forex Strategies - Forex Resources
Ema Metatrader Indicator - Forex Strategies - Forex Resources ...
69# ADX, Parabolic Sar and three EMA - Forex Strategies - Forex
12# Ema, stochasticand RSI - Forex Strategies - Forex Resources
50# Williams % R , Stochastic and EMA - Forex Strategies - Forex
155# EMA CROSS RSI with Digital MACD - Forex Strategies -
72# EMA's, RSI and Stochastic - Forex Strategies - Forex
65# 100 'EMA and MACD “4H Strategy” - Forex Strategies - Forex
76# EMA's Retracement - Forex Strategies - Forex Resources ...
15# Ema Bands - Forex Strategies - Forex Resources - Forex ...
108# EMA's and RSI - Forex Strategies - Forex Resources - Forex
32# 4 EMA and Channel - Forex Strategies - Forex Resources ...
85# Ema's with Trading Range - Forex Strategies - Forex
126# 200 EMA Forex Strategy – - Forex Strategies - Forex ...
9# 6-12 EMA's - Forex Strategies - Forex Resources - Forex
96# EMA Cross - Forex Strategies - Forex Resources - Forex ...
6# Two Ema and MACD - Forex Strategies - Forex Resources ...
70# 3EMA'S - Forex Strategies - Forex Resources - Forex Trading
322# Channel 50 EMA two methods - Forex Strategies - Forex ...
83# 3 EMA's Forex Trading System - Forex Strategies - Forex ...
