


190# Aurora Supertrend Indicator - TradingView
Dimitri 2025
We came across a script online originally shared by Crypto_Wolf_Traders, and it immediately caught our attention.
The concept was solid: combining multiple SuperTrend layers with EMA filtering to detect high-probability entries. After extensive analysis and testing, we decided to refactor the logic, simplify the signals, and build something cleaner.
What emerged is the Aurora Supertrend Indicator – a tool designed for visual clarity, non-repainting entries, and easy-to-read directional context.
Setup indicator
Time frame:any.
Currency pairs:any.
Platform: TradingView.

Trading Rules
Buy
-
Price is above EMA200.
Arrow appears once every X bars while the trend is valid.
Sell
-
Price is below EMA200.
Arrow appears once every X bars while the trend is valid.
Exit position
No exit or stop-loss is provided
This is an entry signal tool. You can combine it with your favorite exit method (e.g., trailing stop, ATR-based SL, fixed RR).
General rules for exit position
Stop loss at the previuos swing high/low.
Profit Target ratio stop loss from 1:1 at :1.3.
Why this works
Instead of chasing every tiny signal, Aurora ST waits for full trend alignment, and then allows a controlled, spaced entry logic. This reduces signal spam and improves psychological clarity during trend trading.
Notes
-
Fully configurable cooldown period (
10by default)Toggle SuperTrend visibility
Transparent repaint-free logic
Examples
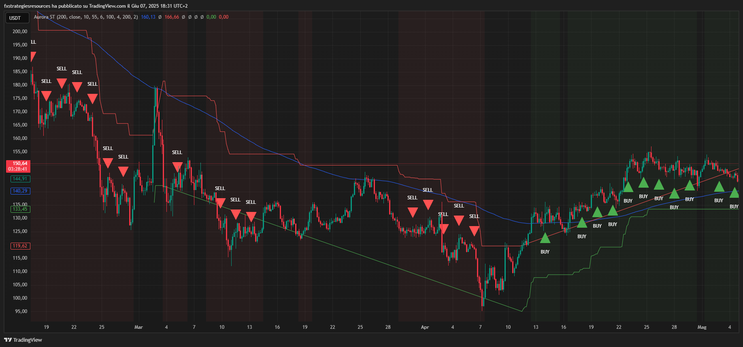
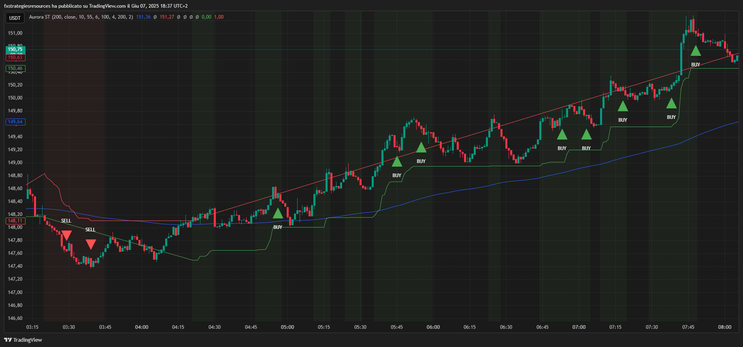
img 1
Dogecoin
In the screenshot, we observe a clean downtrend where:
EMA200 is above price
The SuperTrend lines are red
Sell signals are spaced properly to avoid overloading the chart
As soon as price breaks above EMA200 and the SuperTrends flip green, buy signals begin — again, spaced out every 10 bars
This structured entry logic gives the trader clarity without sacrificing confirmation.
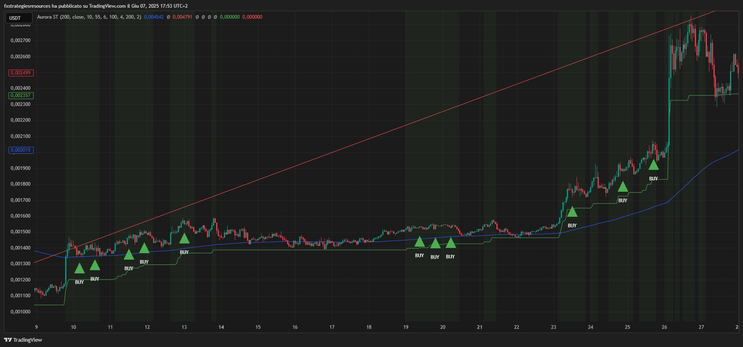
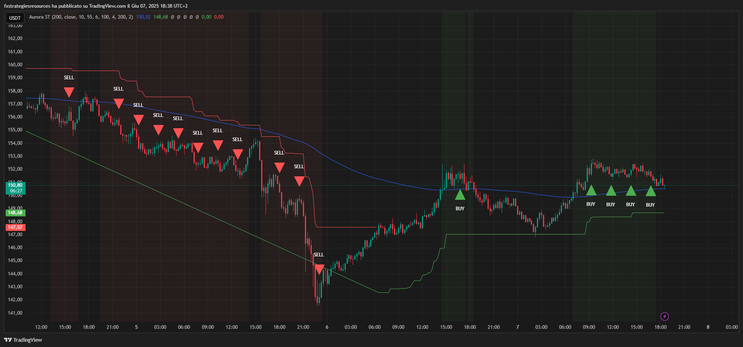
Img 2
this chart perfectly illustrates the clean and structured logic of the Aurora Supertrend Indicator, designed to highlight strong trends while filtering out noise and false signals.
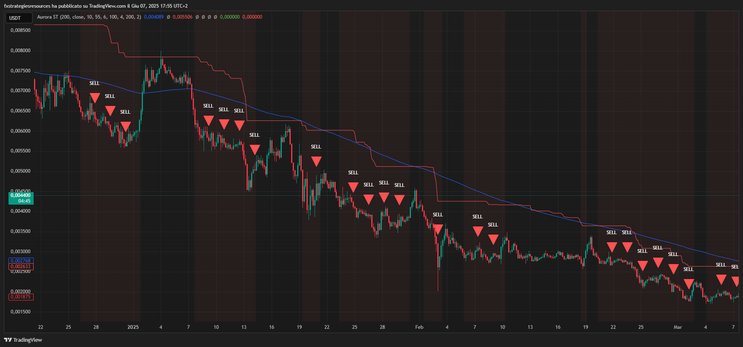
Phase 1 – Sell Trend (left side)
-
The indicator enters a SELL bias when:
-
Price moves below the EMA200 (blue line)
All three SuperTrend layers align to bearish
SELL arrows appear only when the conditions are active and spaced every 10 bars (or your chosen cooldown)
Importantly, no BUY signals appear during the downtrend — thanks to the EMA filter blocking false reversals
-
Result: a clean sequence of short signals, with no premature entries
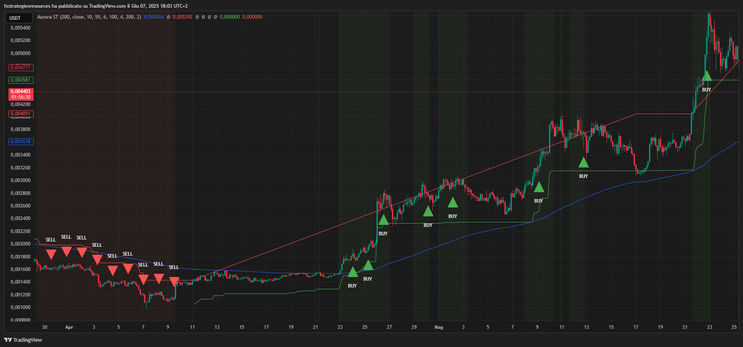
Transition – Breakout & Trend Shift
-
After a base forms, price crosses above the EMA200
SuperTrends begin to flip, but the first BUY appears only when all three are bullish
This delay is intentional — to prevent impulsive or early signals before full confirmation
Phase 2 – Buy Trend (right side)
-
BUY arrows are shown regularly every 10 bars as long as:
-
The price remains above the EMA
SuperTrend conditions stay aligned
The EMA200 begins to slope upward, visually reinforcing the trend direction
Entry signals are spread out cleanly, avoiding overtrading
-
Result: a confident long bias with multiple aligned entries across the bullish run
Key Observations
-
No signal repainting: every arrow stays exactly where it was generated
No false signals during chop or consolidation
Visually intuitive layout: even at a glance, the structure is obvious
Conclusion
This chart demonstrates how Aurora ST:
-
Waits for true structure before triggering signals
Keeps your chart clean and confidence-friendly
Can easily become part of a larger trading system
You don’t need to guess trend direction — Aurora Supertrend does the heavy liftin
DOLLY + ISAKAS + NINA Trading System
TIMEFRAME – 30 MIN
PAIR – GU, EU, UJ, UCHF, GJ
INDICATOR
EMA – 50 & 120 = BBANDS STOPS v1
PIVOT BAINS = HEIKEN ASHI
GMACD_SIGNALS = DIGISTOCH
STEPMA = KUSKUS_STARLIGHT
STEP MA NINA = DOJI STAR
DOLLY TRADING TIMES
RULES
LEVEL 1 ( STANDARD)
BUY
BBANDS BLUE, ASHI BLUE, STARLIGHT BLUE, GMACD AND
DIGISTOCH TF4HOUR & DAILY GREEN, CANDLE OPEN ABOVE EMA
50 AND STEP MA NINA BLUE.
SELL
BBANDS RED, ASHI RED, STARLIGHT RED, GMACD AND
DIGISTOCH TF4HOUR & DAILY RED, CANDLE OPEN BELOW EMA
50 AND STEP MA NINA RED.
TAKE PROFIT AND STOP LOSS
TP 40-50 PIPS = SL 40-50 PIPS
LEVEL 2 ( ADVANCED )
BUY
BBANDS BLUE, ASHI BLUE, STARLIGHT BLUE, GMACD AND
DIGISTOCH TF30HOUR & HOURLY GREEN, AND STEP MA NINA
BLUE.
SELL
BBANDS RED, ASHI RED, STARLIGHT RED, GMACD AND
DIGISTOCH TF30HOUR & HOURLY GREEN, STEP MA NINA RED.
TAKE PROFIT AND STOP LOSS
TP- 15-20 PIPS = SL- 20 -30 PIPS OR PIVOT BAIN LEVELS
In the pictures DOLLY + ISAKAS + NINA forex system in action.


Share your opinion, can help everyone to understand the forex strategy.
-
#2
Thank you very much !
-
#1
makasih yah.. bro.. semoga selalu jaya
295# SEFC Universal V.2 - Forex Strategies - Forex Resources ...
162# Trading System, SEFC Palato - Forex Strategies - Forex ...
161# Trading System, SEFC Palato Formula Universal - Forex ...
294# MaKsiGen - Forex Strategies - Forex Resources - Forex ...
156# FX Engine - Forex Strategies - Forex Resources - Forex ...
151# THV 3 - Forex Strategies - Forex Resources - Forex Trading ...
190# DOLLY + ISAKAS + NINA - Forex Strategies - Forex
265# Alpha Trader V.3.1 - Forex Strategies - Forex Resources ...
232# RP - Forex Strategies - Forex Resources - Forex Trading-free
255# IVT - Forex Strategies - Forex Resources - Forex Trading-free
170# IJO ABANG - Forex Strategies - Forex Resources - Forex ...
189# Primajaya - Forex Strategies - Forex Resources - Forex ...
198# Pink FX - Forex Strategies - Forex Resources - Forex Trading
