


171# Super Smoother MA Trend Strategy
Janus Trader 2025
Super Smoother MA Trend Strategy combines two proven technical indicators: Moving Averages (MA) and the Super Smoother Trend filter. It is designed for volatile currency pairs on MetaTrader 4, using timeframes of 3 minutes or higher.
The goal is to catch trends early while filtering out market noise.
Setup
Platform: MetaTrader 4 (MT4)
Timeframes: 3 Minutes (M3), M5, M15, M30, H1 or higher
Currency Pairs: EURUSD, AUDUSD, GBPJPY, USDJPY, XAUUSD, etc. – preferably volatile instruments
Indicators:
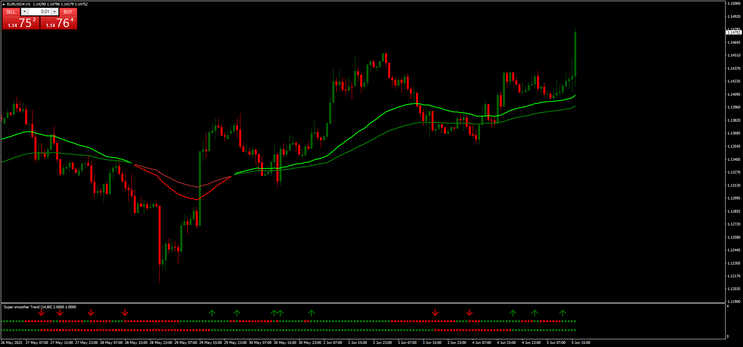
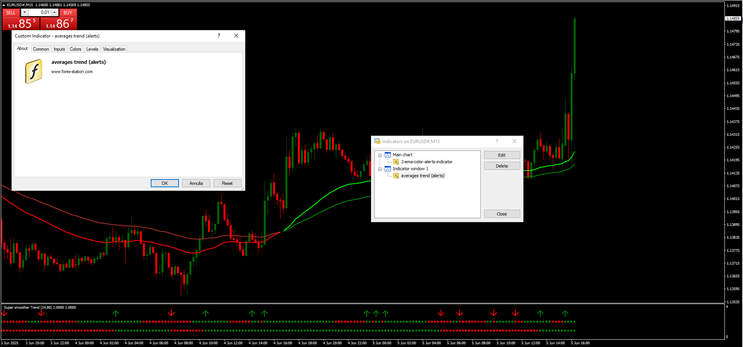
◦ Super Smoother Trend (default settings: Period 14, Beta 0.80)
◦ 2 MA Color:
▪ Fast MA: 21 (color changes based on trend direction)
▪ Slow MA: 50
Indicators on Chart
Super Smoother Trend: Trend filter shown as colored arrows and histogram (green = bullish, red = bearish)
Fast MA (21): Short-term trend direction
Slow MA (50): Medium-term trend direction
Arrows and color shifts indicate potential trade setups
Trading Rules
Buy Setup
1. Super Smoother shows green arrows and green histogram.
2. Fast MA (21) is above the Slow MA (50).
3. Price must be above both MAs.
4. Enter on the close of the candle when all above conditions are confirmed.
Sell Setup
1. Super Smoother shows red arrows and red histogram.
2. Fast MA (21) is below the Slow MA (50).
3. Price must be below both MAs.
4. Enter on the close of the candle when all above conditions are confirmed.
Exit Rules
Take Profit (TP): Use recent swing high/low or a fixed TP (e.g., 1.× ATR or 1× risk).
Stop Loss (SL): Just below the recent swing low (for buy) or swing high (for sell), or behind the slow MA.
Optional: Use opposite Super Smoother signal to exit manually (arrow in opposite direction).

Conclusion
The Super Smoother MA Trend Strategy is designed for traders looking for a clean, trend-following system with high visual clarity. It reduces whipsaws by filtering through two tools: moving average crossover and a trend confirmation filter.
This system works best in trending markets, particularly during volatile sessions (e.g., London/New York overlap). Always test on demo and combine with good risk management.
171# MultiTimeFrame Market Analysis
Submit by Janus Trader (written by Crystal Experiece a )
MULTI-TIMEFRAME MARKET ANALYSIS
Two days ago, a former colleague at my former employment visited me, this time as a student. Having attended several seminal and read so many books needed to know a better way to trade with profits and consistently. I asked if he has a trading system or will have to buy from one of mine. He got one and he explained the setup to me and I found the problem with it.
He was trading the cross of the 14 and 7 SMA in the 1hour timeframe. He shared his DEMO account with me and I studied it and found inconsistencies. Knocked-out with market noise most of the time. I decided to help him fine-tune his trading plan and I came up with the information below.
Successful trading - you need to have a good understanding of Trend in at least 3 different timeframes. One for the Major Trend, the second for counter trend (retracement) and the last one for entry and exit.
INDICATORS
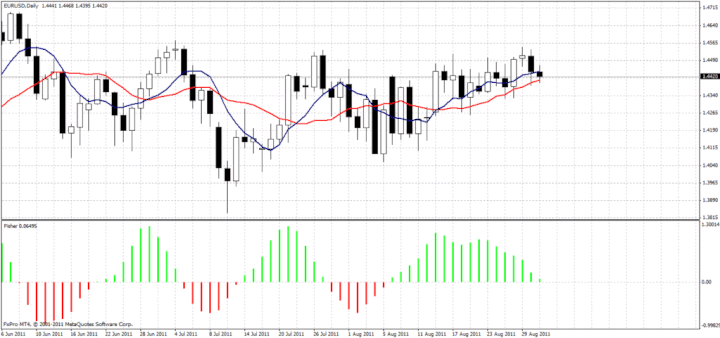
- 14 and 7 SMA
- Default Parabolic SAR
- Fisher
All in Daily, 4hours and 1hour timeframe
TREND
Your trend is in the Daily timeframe. BULL trend when the 7SMA is above the 14SMA in the daily timeframe. Your counter trend or retracement is in the 4hour. A counter BUY is when the 4hour is saying SELL. That is when 7SMA is below the 14SMA in 4hour timeframe when the Daily is still BUYING.
BUY SETUP
The chart of daily timeframe below shows a BUY because the 7SMA blue line is above the 14SMA the red line.
In the pictures MultiTimeFrame Market Analysis forex system in action.
When the trend is determine, it’s good to wait for a retracement or counter trend in 4hour timeframe so you wait for SELL trend in 4hour when the BUY trend still remain in Daily timeframe. The 4hour chart below shows a counter trend.

Now we watch the 1hour timeframe for entry. You want to trade BUY when 7SMA is above 14SMA. Obviously you will have several BUY noise in this timeframe, but the one you want to trade is the BUY at the point where Fisher 10 of 4hour is green. Like the 1hour chart below:

Your stoploss is the lowest Low and you can figure out your take-profit as same pips with Stoploss or more or depending on your risk plan.
Now do you have your favourite indicator and you need the right combination of timeframe to better maximize your use of them, then visit http://crystal-markets.blogspot.com/ for details.
