


287# Joker Algo Reversal & Continuation Strategy -TradingView_
Dimitri 2025
The Joker Algo is a multi-signal trading system designed to reveal trend direction, reversal opportunities, and institutional price levels. Based on the chart provided, we can formulate a structured and disciplined trading strategy suitable for volatile currency pairs (USD/JPY, GBP/JPY, XAU/USD, GBP/USD, EUR/JPY, etc.) on 15-minute or higher timeframes.
The Joker Algo provides all
three by combining reversal signals, add-on zones, breaker blocks, and dynamic support/resistance.
This strategy turns those visual elements into a rule-based approach designed for trend-following and counter-trend precision entries.
Tools & Setup Requirements
-
Indicator: Joker Algo,
Timeframe: 15 minutes or higher,
Assets: Volatile Forex pairs (USD/JPY, GBP/JPY, EUR/JPY, GBP/USD, XAU/USD, etc.),
Market Type: Works best in trending or structured ranges with clear swing points.
2. Core Components Visible in the Chart
From the chart provided, Joker Algo uses:
Reversal Signals
-
Reversal Down (red text)
Reversal Up (green text)
These appear at swing highs/lows and often precede structural shifts.
Buy/Sell Signals
Labeled as Buy (green) and Sell (red).
Used to confirm a trend direction.
Add-On Signals
Marked as Add, usually near continuation levels.
These help scale into winning trends.
Dynamic Zones
-
Supply (red regions)
Demand (green regions)
These highlight institutional liquidity levels where reversals or continuations often form.
Breaker or BOS (Break of Structure)
Used to validate trend changes.
3. Joker Algo Strategy Rules
A. Buy Strategy (Long Trades)
Entry Conditions
-
A Reversal Up signal prints near a demand zone.
-
Price must stay above the most recent breaker/BOS level.
-
A Buy label confirms bullish direction.
-
Enter on:
-
Candle close above the signal
Or retest of the nearby demand zone
-
-
Optional: Add to the position when “Add” signals appear in the bullish direction.
Stop Loss
-
Below the previous swing low
Or below the demand zone boundary
Take Profit
-
Next supply zone
Or use trailing stop behind structural lows
B. Sell Strategy (Short Trades)
Entry Conditions
-
A Reversal Down signal prints near a supply zone.
-
Price stays below the most recent BOS/breaker level.
-
A Sell label confirms bearish trend direction.
-
Enter on:
-
Candle close beneath the signal
Or retest of the nearby supply zone
-
-
Optional: Scale in when Add signals appear on bearish continuation candles.
Stop Loss
-
Above recent swing high
Or above the supply zone
Take Profit
-
Next demand zone
Or trail above each lower high
4. Best Market Conditions
This strategy performs best when:
-
The pair is volatile with clean swings
Zones (supply/demand) are respected repeatedly
Market is trending or forming clear liquidity grabs.
Avoid using it during:
-
Ultra-low volatility sessions
Major news spikes (unless advanced trader).
5. Risk Management Guidelines
-
Risk 0.5%–1.5% per trade.
Avoid counter-trend trades unless all reversal conditions align.
Use the “Add” entries only once the trade is in clear profit.
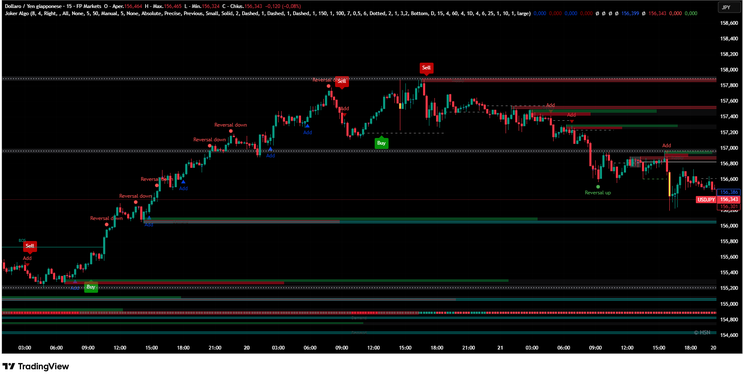
6. Example Interpretation of the Chart (1)
From the chart:
-
Price rallies from demand with Reversal Up → Buy → Add, confirming trend continuation.
At the top, Reversal Down → Sell, forming a clean bearish reversal from supply.
Subsequent Add-on signals help build the short position as trend weakens.
This chart exemplifies how accurately Joker Algo combines structural signals with directional confirmation.
Conclusion
The Joker Algo Reversal & Continuation Strategy
is a powerful tool for FX traders who want clarity in trend direction, clean entries, and effective scaling techniques.
By following strict rules—based on reversal signals, BOS confirmation, and institutional zones—traders can build a reliable system suitable for volatile markets on 15-minute or higher
timeframes.

287# Medekarama TeKniK Trading System
Submit by Ketang 21/01/2012
Kelebihan Teknik Merdekarama adalah ianya mengabungkan beberapa indicator yang
bergerak dalam beberapa timeframe dan digunakan dalam satu paparan timeframe M30.
Jadi dengan melihat paparan M30 kita akan dapat melihat semua trend panjang dan trend
semasa.
Jika dilihat diatas saya juga memecahkan kepada 4 bahagian:-
a. Major Trend.
b. Medium Trend.
c. Semasa
d. Sokongan
Kesemuanya mempunyai fungsi yang berbeza dan telah diterangkan ringkas di charts
diatas.
Teknik Ulat dan Trend
In the picture Madejarama TeKniK forex system in action.
Ini merupakan teknik asal dalam Teknik Merdekarama. Ianya mudah dikenali dan
dipelajari kerana digunakan dalam Teknik Merdekarama Ver1.0. Namun inaya
diringkaskan dalam paparan Teknik Merdekrama Ver 2.0 SE
Cara masuk adalah begini :-
BUY ~ Pastikan langkah 1 adalah biru.
Diikuti Traderwawasan MACD juga biru.
Dan masuk di leher ulat diawal trend.
( sekiranya ulat telah lama keluar sebagai contoh dah 3 c/stik baru yang lain sama
warna..maka masuk di awal c/stick juga.)
* Sekiranya c/stick dah bergerak lebih dari 4 c/stick cuba elakkan dari membuat OP
namun jika sesuai ianya dibenarkan. Disini kefahaman c/stick juga diperlukan .
Untuk proses SELL pula adalah secara bersilang dari contoh BUY.
Stop Loss boleh diletakkan di bawah ekor ulat. Sekiranya menggunkan trailing stop
pastikan ianya sesuai dengan pair yang digunakan.
Kelebihan : boleh menggunakan 10 TP atau swing.
Ini adalah teknik paling selamat dan tidak pernah menghampakan seseorang. Ianya agak
rumit sedikit namun sekiranya kita memahami asasnya ianya pula menjadi amat senang
sekali.
Caranya:-
Konsep : Pastikan SEMUA warna adalah sama . Biru untuk BUY dan Merah untuk
SELL.
Disini ianya tidak mengikut apa-apa syarat tertentu cuma hanya memastikan warna
sahaja.
Anda boleh guna 10TP atau swing disebabkan ianya confirm akan membantu anda.
Kelebihan : saya menyertakan LTW ( Line TraderWawasan ) ianya adalah satu line yang
dapat menentukan pergerakkan awal trend. Syarat menggunakannya adalah seperti
berikut.
a. Garisan LTW akan bergerak keatas dan kebawah.
b. Ianya dibantu dgn level yang ditetapkan. 20 dan 80
c. Sekiranya LTW bergerak dari bawah ke atas dan mencecah level 20 maka kita
akan tau keadaan BUY akan berlaku sebentar lagi.
d. Sekiranya LTW mencecah ke 80 maka keadaan BUY amat CONFIRM .
e. Kita akan mengambil BUY bila ianya mencecah 20.
f. Selagi ianya berada di atas level 80, keadaan BUY adalah valid…sila sahkan
dengan indicator lain sebelu membuat OP.
g. Keadaan BUY akan tamat apabila LTW mula turun kembali mencecah level 80
dan digantikan dengan SELL.
h. Untuk keadaan SELL pula adalah sebaliknya.
