288# Forex Stryder Strategy MT4
Dimitri 2025
The Stryder Forex Trading Strategy is a trend-following system designed to simplify market analysis and help traders identify high-probability trade setups. It combines two core components: the Stryder Entry Signals, which appear directly on the price chart, and the Rate of Change (ROC) indicator, displayed in a separate window to measure market momentum.
Strategy Structure
Stryder Entry Signals
On the main chart, the system plots a central trend line and two bands that outline short-term overbought and oversold zones.
These elements change color depending on the market direction:
-
Green → bullish trend
Red → bearish trend
When the strategy detects a potential trade setup, it places buy or sell arrows on the chart. These arrows act as the primary entry triggers for the strategy.
Stryder ROC Indicator
The ROC indicator, located below the price chart, monitors price changes across up to 20 currency pairs.
Its color reflects the momentum:
-
Green → positive momentum
Red → negative momentum
Using the ROC as confirmation helps filter out weak signals and identify stronger trend moves.
Flexibility
The strategy works across all timeframes and currency pairs.
All settings can be customized, allowing traders to align the tool with their preferred trading style—scalping, intraday, or swing trading.
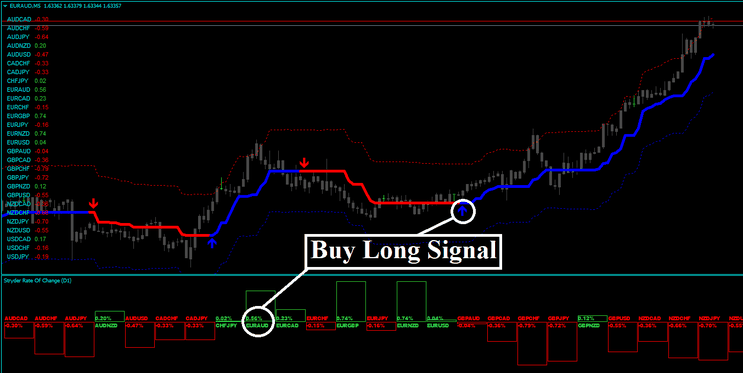
Buy Signal Steps
-
Stryder turns blue
The trend line and bands shift to blue, indicating a possible bullish environment. -
Upward arrow appears
The arrow marks the suggested long entry area. -
ROC confirms positive momentum
The ROC should be green, confirming upward pressure. -
Enter Long
When all conditions align, a buy trade can be executed. -
Stop Loss
Place the stop a few pips below the buy arrow for protection. -
Take Profit / Exit
Exit when a sell arrow appears, or use your own target-management method.

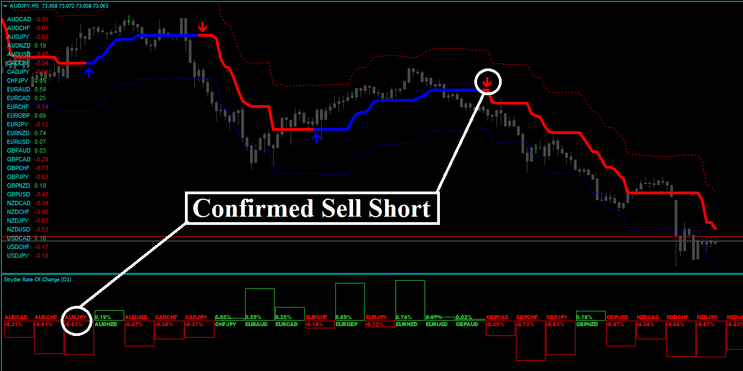
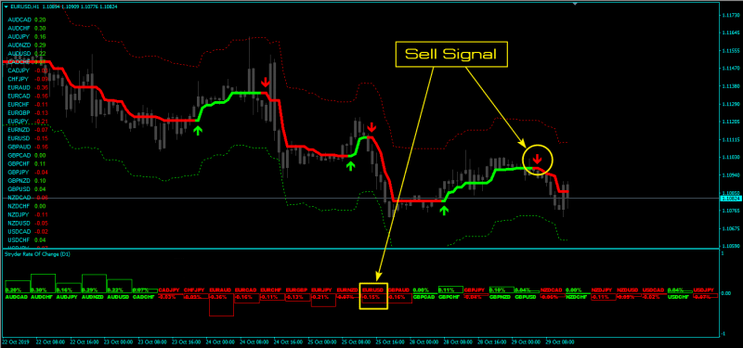
Sell Signal Steps
-
Stryder turns red
Indicates the start of a potential bearish phase. -
Downward arrow appears
Identifies the suggested short entry area. -
ROC confirms negative momentum
The ROC should be red, validating the bearish bias. -
Enter Short
Open a sell position when all conditions match. -
Stop Loss
Place it a few pips above the sell arrow. -
Take Profit / Exit
Close the position when an opposite (buy) arrow appears or use your preferred exit method.
Final Thoughts
The Stryder Forex Trading Strategy combines visual clarity with momentum confirmation, making it a practical and adaptable tool for traders of all levels. Its clean structure and customizable settings allow it to fit seamlessly into various trading approaches.
288# FX Divergence Trading System
Divergence Trading with FX% MACD
Submit Johnn Trader 22/01/2012
Currency:all.
Time Frame 15 or higher.
Indicators:FX5 MACD Divergence, CCI (14), Stochastic (8,3,3).
Long Entry
1. The appearance of the divergence in the indicators window for purchase FX5_Divergence draws the green arrow.
2. CCI indicator crosses -100 upwards.
3. Stochastic indicator crosses its line (signal) from the bottom up (preferably so that it was oversold, ie below 20).
Short Entry
1. The appearance of the divergence in the indicators window for sale - Forex IndicatorFX5_Divergence draws a red arrow.
2. CCI indicator crosses the line - 100 from the top down.
3. Stochastic indicator crosses its line (signal) from the top down (it is desirable that this be in the overbought zone, ie above 80).
You can see examples:
Stop-loss should be put on the extremum of candles, which you opened a trading position. Closing the trade position occurs after crossing the CCI of the opposite level.
In the pictures FX Divergence forex system in action.