276# Wave Cipher AutoFib Trend Scouter - Tutorial-
Maximo trader 2025
The Wave Cipher AutoFib Trend Scouter is an advanced multi-layer technical analysis tool for TradingView that combines:
-
WaveTrend (Cipher B)
RSI + MFI
Stochastic RSI
Divergences
Elliott Wave Auto-Detection
Automatic Fibonacci levels
Trend Confirmation Signals
It’s designed to identify momentum shifts, divergences, and wave structures for precise entry/exit decisions.

2. Input Settings Breakdown
WaveTrend Settings
-
WT Channel Length / Average Length: control the smoothing speed of the oscillator.
Overbought / Oversold levels: typically 53 / -53 are standard.
Show Divergences: draws bullish/bearish divergence points.
Show Buy/Sell/Gold Dots: toggles visual signals.
RSI & MFI Settings
-
MFI Period / Multiplier: controls how sensitive the money flow area is.
RSI Length / Source: standard RSI parameters (default 14).
Show Divergences: highlights RSI-based divergence points.
Stochastic RSI Settings
-
RSI Length / Stochastic Length / Smoothing: controls oscillation.
Use Log: logarithmic smoothing for more stable output.
Average K & D: optional smoothing between lines.
Elliott Wave Settings
-
ZigZag Lengths (1/2/3): define the pivot sensitivity.
Colors: choose colors for each wave layer.
Fibonacci Levels: define retracement ratios.
Show ZZ: toggle the ZigZag base lines.

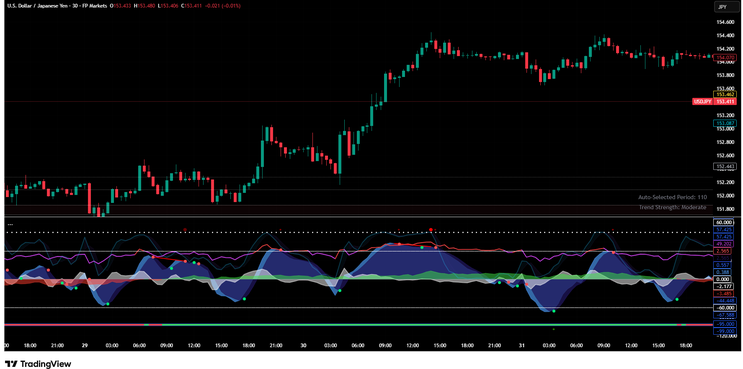
3. Reading the Chart
Buy Signals
-
Green dot below zero = WT bullish cross in oversold area.
Green “•” circle = bullish divergence detected.
Orange “•” circle = gold buy setup (strongest).
Confirm with MFI turning green and Stochastic RSI rising.
Sell Signals
-
Red dot above zero = WT bearish cross in overbought area.
Red “•” circle = bearish divergence detected.
Confirm with MFI turning red and RSI dropping.
Elliott Waves
-
Blue or white numbered waves (1–5) indicate impulsive structure.
Letters (A–B–C) indicate corrective structure.
New patterns trigger alerts like “New EW Motive Bullish Pattern found.”
If structure breaks → alert: “Invalidated EW Pattern.”
Fibonacci Bands
-
Lines at 0.5, 0.618, 0.764, 0.854 retracement levels.
-
Green = level intact (wave likely still valid).
-
Red dotted = level broken (trend invalidation).
4. Practical Use Case
-
Identify a WT Buy Dot near oversold levels.
-
Confirm with a bullish divergence (•) on WaveTrend or RSI.
-
Check MFI area turning positive (green).
-
Ensure Stochastic RSI is crossing upward.
-
Optionally validate wave structure (Wave 2 or 4 correction ending).
-
Enter position with stop below last swing low.
-
Watch AutoFib levels for take-profit zones.
5. Tips for Use
-
Works best on 15min–4H timeframes.
Combine with price action and volume profile for confirmation.
Disable unnecessary features (Sommi, MACD colors) for clarity.
If colors look off, enable Dark Mode.
6. Alerts (pre-built in script)
-
Buy / Sell dots
Divergence-based entries
Elliott Wave pattern detection
Wave invalidations (break of Fibonacci zones)
You can enable these alerts manually in TradingView after adding the indicator.


276# FX Trend Stuffer Trading System
Submit by Janus Trader
This is the first step you take when starting to look into trading. You know that its a
good way of making money because you've heard so many things about it and heard
of so many millionaires. Unfortunately, just like when you first desire to drive a car
you think it will be easy - after all, how hard can it be? Price either moves up or
down - what's the big secret to that then – let’s get cracking!
Unfortunately, just as when you first take your place in front of a steering wheel you
find very quickly that you haven't got the first clue about what you're trying to do.
You take lots of trades and lots of risks. When you enter a trade it turns against you
so you reverse and it turns again and again, and again.
You may have initial success, and thats even worse - cos it tells your brain that this
really is simple and you start to risk more money.
You try to turn around your losses by doubling up every time you trade. Sometimes
you'll get away with it but more often than not you will come away scathed and
bruised You are totally oblivious to your incompetence at trading.
This step can last for a week or two of trading but the market is usually swift and
you move on the next stage. (see manual)
Trend Stuffer Forex Trading System