


290# SuperTrend Finder Lines S&R WaveTrend -TradingView -
Janus Trader 2025
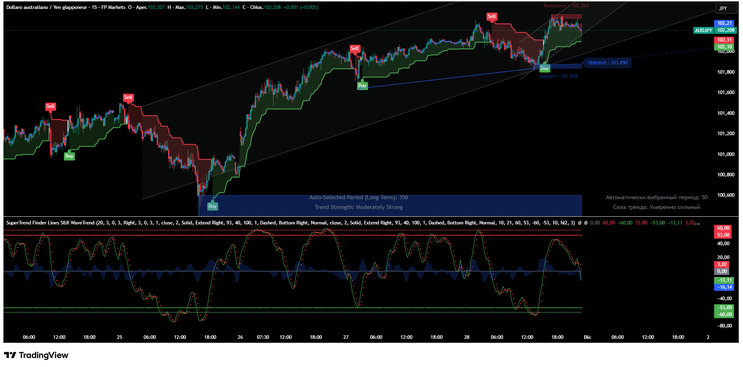
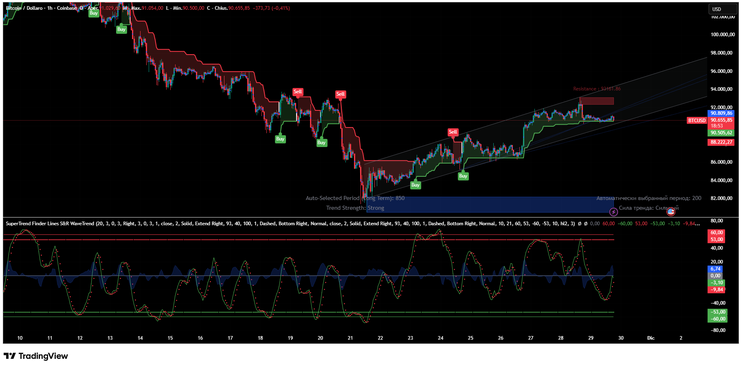
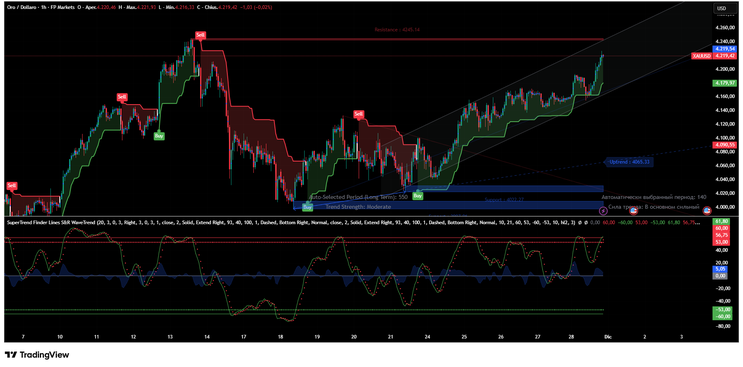
The SuperTrend Finder Lines S&R WaveTrend indicator is a multifunctional TradingView tool that combines several advanced systems into one framework:
-
SuperTrend signals (Buy/Sell),
Automatic Trend Lines,
Support & Resistance detection,
Adaptive Trend Channels (with Pearson’s R strength),
WaveTrend momentum oscillator (LazyBear version),
1. What the Indicator Does (Overview)
This indicator merges several powerful analysis methods into a single tool:
A. SuperTrend System (Buy/Sell Signals)
The SuperTrend module calculates:
-
ATR-based upper/lower bands,
-
Trend direction flips,
-
Automatic Buy and Sell labels,
-
Highlighted trend zones (green = bullish, red = bearish).
It visually shows when price flips from a downtrend to an uptrend or vice versa.
B. Automatic Trend Lines (Uptrend & Downtrend)
The script scans pivot highs and lows and automatically draws:
-
Uptrend lines from higher lows,
Downtrend lines from lower highs,
Extension lines to show continuation,
Violation detection (trend line breaks),
Alerts when a trend line is broken,
These trend lines update dynamically as the market evolves.
C. Automatic Support & Resistance Zones
The script identifies pivot-based levels and draws:
-
Blue shaded support boxes,
Red shaded resistance boxes,
Optional labels showing exact levels,
Alerts when support/resistance is broken,
This helps you identify key price zones without manual drawing.
D. Adaptive Trend Finder Channels (Pearson’s R)
This is one of the most advanced parts of the code.
The indicator:
-
Tests many different periods (long-term or short-term)
-
Calculates log-price linear regression
-
Finds the period with the strongest trend (highest Pearson correlation)
-
Builds a trend channel using:
-
Midline,
Upper deviation band,
Lower deviation band.
-
-
Displays a table showing:
-
Auto-selected period,
Trend strength (Extremely Weak → Ultra Strong),
Pearson’s R value (optional),
Annualized return (CAGR) for daily/weekly charts.
-
This gives a statistical measure of trend quality, not just visual intuition.
E. WaveTrend Oscillator (LazyBear)
Displayed below the chart, it includes:
-
WT1 (green line),
WT2 (red line),
Overbought and oversold levels,
Momentum crosses,
WaveTrend divergences and reversals,
This helps you detect early turning points and confirms entries.
2. How to Use the Indicator (Step-by-Step)
Step 1 – Follow the SuperTrend Direction
-
Green zone = Buy bias
Red zone = Sell bias
Buy signals occur when price closes above the SuperTrend line.
Sell signals occur when price closes below it.
Use these as your primary trend filter.
Step 2 – Confirm with WaveTrend
Combine SuperTrend signals with WaveTrend momentum:
Strong Buy if:
-
SuperTrend turns green,
WaveTrend crosses upward from oversold.
Strong Sell if:
-
SuperTrend turns red,
WaveTrend crosses downward from overbought.
Step 3 – Use Trend Lines as Validation
When price touches or breaks an auto-detected trend line:
-
If an uptrend line breaks → risk of reversal
If a downtrend line breaks → possible bullish reversal
The script sends automatic alerts for these events.
Step 4 – Watch Support & Resistance Zones
Trade entries and exits are stronger when they align with S&R zones:
-
Buy on support drops in an uptrend,
Sell on resistance in a downtrend,
Avoid entering immediately into support/resistance,
These boxes give high-probability reaction areas.
Step 5 – Interpret the Adaptive Trend Channel
This is the most advanced tool in the indicator.
The channel tells you:
-
Trend direction (up or down),
Trend strength (Pearson’s R),
How extended price is from the midline,
Whether to expect continuation or pullback.
If price is near the upper channel → market is extended.
If price is near the lower channel → potential rebound zone.
The internal table gives crucial data for decision-making.
3. Why This Indicator Is Worth Using
1. Combines Multiple Tools into One
Instead of using separate indicators for trend, S&R, channels, and momentum, this script merges everything, giving a more complete picture.
2. Automatically Draws Key Market Structures
Trend lines + support/resistance zones update in real time without manual analysis, saving time and improving consistency.
3. Objective Trend Strength Measurement
Using Pearson’s R makes trend analysis statistical, not
subjective.
You know whether a trend is: weak, moderate, strong, or ultra-strong.
4. High-Precision Buy/Sell Signals
The combination of:
-
SuperTrend flips,
WaveTrend momentum,
Trend channels,
results in very solid confirmations.
5. Great for All Markets and Timeframes
Works for:
-
Forex,
Crypto,
Stocks,
Commodities.
And on:
-
Scalping (1–5 min),
Swing trading (1h–4h),
Position trading (daily/weekly).
6. Alerts for Breakouts, Trend Shifts, and S&R Violations
You don’t need to watch charts all day—alerts notify you when key events happen.
4. Summary (in simple terms)
This indicator is powerful because it acts like a complete trading system, giving you:
-
Trend direction,
Trend strength,
Price channels,
Support and resistance,
Trend lines,
Buy/Sell signals,
Momentum confirmation.
All fully automated and visually clear.

290# Supertrend SAR Trading System

Submit by Ozzy Trader 23/01/2012
Time Frame 15min or higher.
Currency pairs:all
Indicators/
-SUPERTREND(8, 1.5)
-SAR(0.2.0.2)
WHEN TO ENTER A TRADE:
Enter: a BUYtrade when SUPERTREND is in a bullish trend(line is green), and SAR gives a BUY signal. (Don't enter a SELL trade if SUPERTREND is bullish and SAR gives a SELL signal.
Enter: a SELL trade when SUPERTREND is in a bearish trend(line is red), and SAR gives a SELL signal. (Don't enter a BUY trade if SUPERTREND is bearish and SAR gives a BUY signal.
Get out of a BUY trade when SAR give a SELL signal, and the opposite for a SELL trade.

Moni (Thursday, 22 January 2026 18:14)
I’m genuinely impressed by this setup. The combination of SuperTrend, automatic trend lines, dynamic support/resistance zones, and WaveTrend creates a remarkably complete and well‑structured trading framework. It goes far beyond the usual “single‑indicator” approaches you see everywhere. You can tell there’s real thought behind how each component interacts with the others.
What stands out the most is the Adaptive Trend Channel based on Pearson’s R. It’s refreshing to see a statistical approach that actually measures trend quality instead of relying only on visual interpretation. The automatic S/R levels are also extremely useful for swing traders, removing the need to constantly redraw zones manually. WaveTrend then adds an extra layer of confirmation that filters out many weak signals.
Overall, this system offers a deeper, cleaner, and more coherent way to read market structure without cluttering the chart. It feels modern, balanced, and suitable for both short‑term and higher‑timeframe strategies. Excellent work — a solid, well‑designed tool that I’d definitely recommend to traders looking for a more complete and reliable setup.