


294# ICT Killer Zone Tutorial -TradingView-
Based on ICT Killer zones, Market Structure, Order Blocks, FVGs
Maximo trader 2025
1. Strategy Overview
The ICT Zone Killer Strategy combines three core Smart Money Concepts:
-
Killzones (Time-Based Liquidity Windows)
-
Market Structure Shifts (CHOCH & BOS)
-
Institutional Price Levels (Order Blocks, FVGs, Premium/Discount zones)
The goal:
👉 Trade only when the highest probability conditions align — during sessions where liquidity is injected into the market.
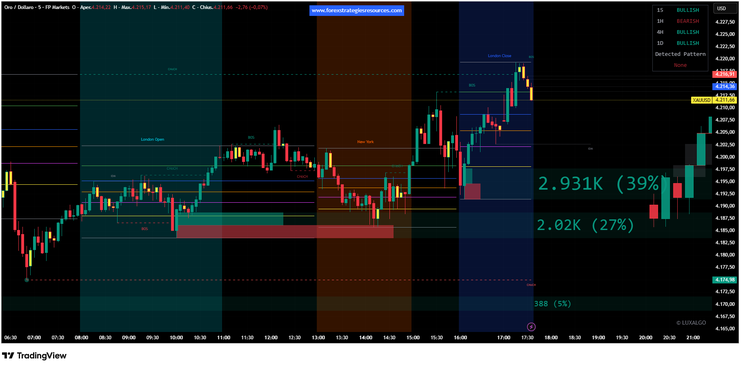
The indicator automatically identifies:
-
London Open / New York AM / New York PM killzones
Swing & internal structure (BOS, CHOCH, CHOCH+)
Order blocks (OBs)
Fair Value Gaps (FVG / VI / OG)
Premium, Equilibrium, and Discount zones
Multi-timeframe trend bias (15m, 1H, 4H, 1D)
This gives a complete Smart Money System for intraday trading.
2. Core Principles of ICT Zone Killer
(A) Killzones
Killzones represent times when liquidity is delivered into the market:
-
London Open: Breakouts and liquidity grabs
New York AM Session: Main trend expansion
New York PM Session: Reversals or continuation moves
During killzones, the market often forms:
-
Stop hunts
Liquidity sweeps
True directional moves
You only take trades during or immediately after a killzone.
3. Market Structure Logic
The indicator identifies Internal and Swing MS:
Internal Structure
Used for entry confirmation:
-
CHOCH → potential reversal
CHOCH+ → strong reversal
BOS → continuation expansion
Swing Structure
Used to determine overall direction:
-
Swing BOS → trend continuation
Swing CHOCH → trend reversal
MTF scanner shows trend direction for:
-
15m
1H
4H
1D
You trade in alignment with higher-timeframe bias (1H or 4H).
4. Institutional Zones
The script identifies:
Order Blocks (Bullish / Bearish)
-
Areas where institutions previously created imbalance
Used as entry zones after a sweep or mitigation
Visualized with volume metrics (“1.317K (23%)” etc.)
Fair Value Gaps (FVG / VI / OG)
-
Used as trade imbalance targets
Or as entry mitigation for continuation moves
Premium / Discount Zones
-
Price above equilibrium → look for sells (premium)
Price below equilibrium → look for buys (discount)
You only buy in discount, and only sell in premium.
5. Entry Conditions (Buy Example)
✅ Step 1 — HTF Bias
1H / 4H trend must show BULLISH.
✅ Step 2 — Killzone Trigger
Price must be inside:
-
London Open
ORNew York AM session
✅ Step 3 — Liquidity Sweep
Price sweeps a:
-
Swing Low
Equal Low
Killzone Low
(Script marks CHOCH/CHoCH+)
✅ Step 4 — Market Structure Shift
Look for internal CHOCH or BOS to upside.
✅ Step 5 — Entry at Institutional Zone
Enter on:
-
Bullish Order Block
FVG retracement
Discount zone confirmation
🎯 Targets
-
Next FVG
Opposite liquidity pool (highs)
Session high
🛑 Stop Loss
-
Below the swept low or beneath the OB
6. Entry Conditions (Sell Example)
✅ HTF bias: BEARISH
✅ Price enters London/NY killzone
✅ Liquidity sweep of highs
✅ Internal CHOCH or BOS down
✅ Entry at:
-
Bearish Order Block
FVG retracement
Premium zone
Targets:
-
Discount zone
Previous lows
FVG below
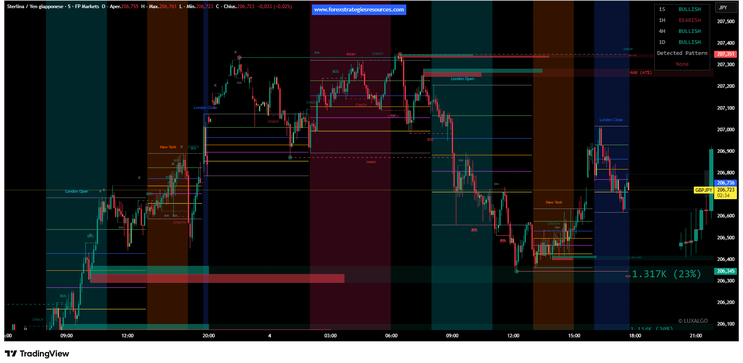
7. Example Workflow (based on screenshots)
GBP/JPY
The chart shows:
-
London Open → liquidity sweep
CHOCH+ → strong bullish reversal
Bullish OB formed
Entry on retracement
Expansion → New York killzone
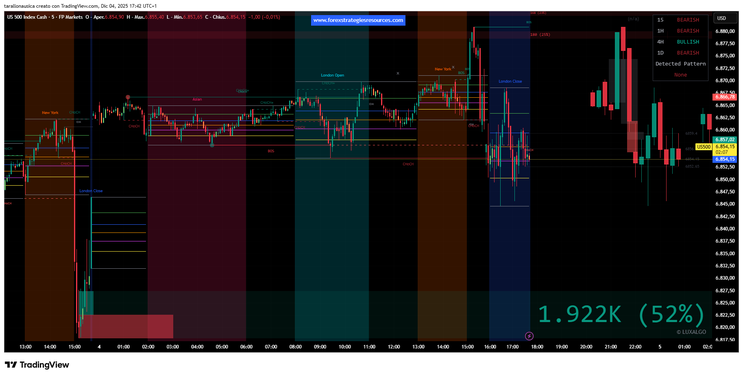
US500
-
Asian session consolidation
NY session BOS → direction shift
Price retraces into OB
FVG fills → entry
Trend expands until NY close
This matches ICT Zone Killer logic perfectly.
8. Risk Management
-
Risk per trade: 0.25%–1%
Always place SL beyond liquidity sweep
Avoid trading outside killzones
Do not chase price that didn’t return to zone
9. When NOT to Trade
No clear HTF bias
No sweep / no displacement
No Killzone
Choppy session (low volatility)
Final Summary
ICT Zone Killer Strategy =
Liquidity event (sweep)
Killzone timing
Market structure shift
Institutional zone entry (OB / FVG)
Premium/Discount filtering
MTF trend confirmation
This creates an extremely precise, high-quality intraday trading framework.
294# MaKsiGen Trading System
Submit by joy22 03/02/2012
see images
There are some really good moves here that could have generated lots of pips for the savvy trader. My job here is to get you into those moves with minimal risk and the maximum profit. I look for up to four moves, like those above, per day. They don’t happen every day regardless, there are flat days. It’s not just the EUR/USD that presents moves like this almost on a daily basis, most pairs show similar movement. The EUR/USD on the next chart also exhibits some great intra-day moves.
295# SEFC Universal V.2 - Forex Strategies - Forex Resources ...
162# Trading System, SEFC Palato - Forex Strategies - Forex ...
161# Trading System, SEFC Palato Formula Universal - Forex ...
294# MaKsiGen - Forex Strategies - Forex Resources - Forex ...
156# FX Engine - Forex Strategies - Forex Resources - Forex ...
151# THV 3 - Forex Strategies - Forex Resources - Forex Trading ...
190# DOLLY + ISAKAS + NINA - Forex Strategies - Forex
265# Alpha Trader V.3.1 - Forex Strategies - Forex Resources ...
232# RP - Forex Strategies - Forex Resources - Forex Trading-free
255# IVT - Forex Strategies - Forex Resources - Forex Trading-free
170# IJO ABANG - Forex Strategies - Forex Resources - Forex ...
189# Primajaya - Forex Strategies - Forex Resources - Forex ...
198# Pink FX - Forex Strategies - Forex Resources - Forex Trading
