


152# Self-Aware Trend System (SATS) Trading Strategy for MT5
Janus Trader 2026
The Self-Aware Trend System version 1.8.3 is an advanced adaptive trading indicator for MetaTrader 5 that combines a sophisticated SuperTrend engine with a proprietary Trend Quality Index (TQI)
www.mql5.com
. This intelligent system automatically adjusts to market conditions by distinguishing between trending and choppy markets, compressing bands during clean trends to lock in profits tighter, and widening them in noisy conditions to avoid premature exits.
The SATS indicator operates through multiple interconnected modules that work together to generate high-probability trading signals. The primary components include the Trend Quality Engine which measures trend strength through the TQI value, the Efficiency Ratio that evaluates price movement quality, and the Adaptive Engine that modifies band width based on market volatility. The system also incorporates RSI for momentum confirmation, Volume Z-score for volume analysis, and Momentum Persistence to identify sustained price movements.
Key settings visible in the configuration include an ATR Length of 13 periods, Base Band Width set to 2.0 times ATR, Efficiency Window of 20 periods, and Adaptation Strength of 0.5. The indicator uses an ATR Baseline Length of 100 periods for long-term volatility assessment, with Quality Influence set at 0.4 to balance trend quality against raw price action. The system enables Vol-Adaptive Bands, Trend Quality Engine, Smooth Adaptive Multipliers, Asymmetric Bands, and Character-Flip Detection for optimal performance across different market regimes.
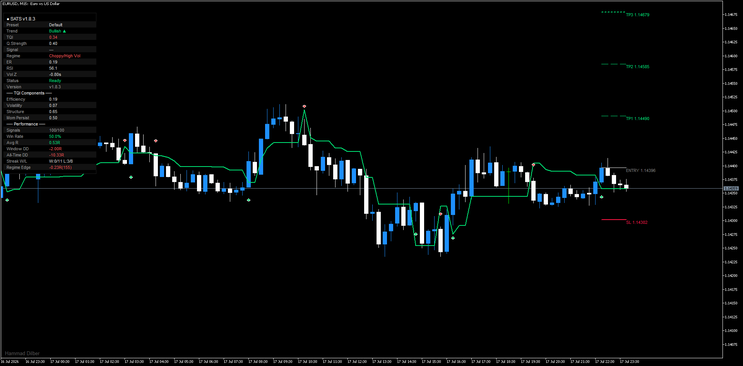
Entry Signal Rules
Enter long positions when the indicator displays a Bullish trend signal with the TQI value above 0.20 and the Status shows Ready. The Regime should indicate Choppy/Norm Vol or Trending conditions rather than Mixed/High Vol environments. Wait for price to close above the adaptive trend line which will appear in green, and confirm that the Efficiency component shows a value above 0.05 indicating meaningful price movement. The RSI should be between 40 and 70 to confirm momentum without overbought conditions, and the Volume Z-score should ideally be positive showing above-average participation.
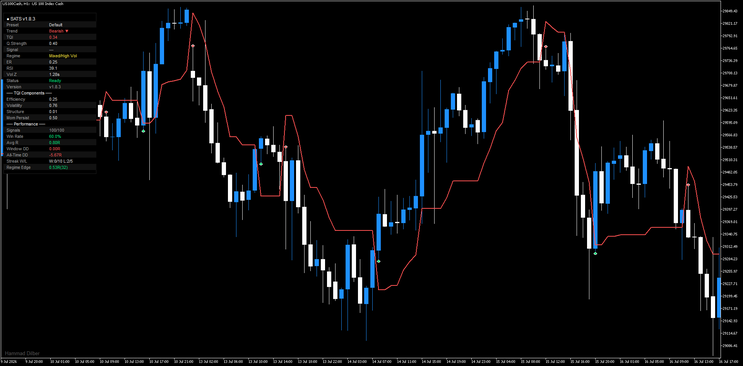
For short positions, enter when the Trend displays Bearish with TQI above 0.20 and Status Ready. Price must close below the red adaptive trend line with the Regime showing favorable conditions. The Efficiency reading should exceed 0.05 in absolute terms, RSI should sit between 30 and 60 confirming downward momentum without oversold extremes, and Volume Z should support the move with positive or neutral readings.
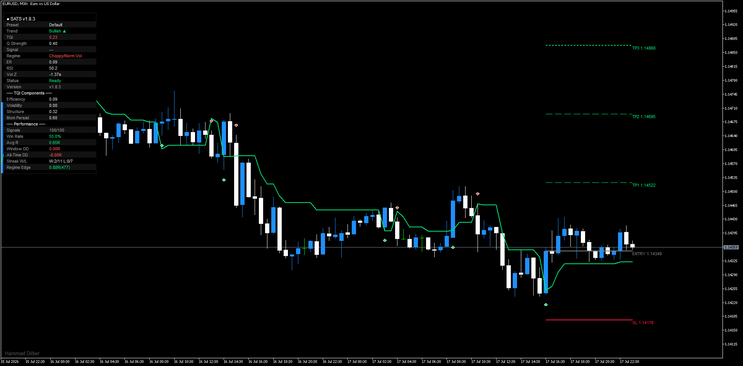
Risk Management and Position Sizing
The indicator automatically calculates three take-profit levels labeled TP1, TP2, and TP3 based on multiples of the ATR and current market structure. TP1 typically sits at 1.0 times the risk multiple, TP2 at 2.0 times, and TP3 at 3.0 times allowing for partial profit taking at each level. The stop loss is dynamically placed below or above the adaptive band depending on trade direction, with the SL Buffer set to 1.5 times ATR to account for normal market noise.
Position sizing should be calculated based on the distance between entry and stop loss levels, risking no more than 1-2% of account equity per trade. The indicator displays performance metrics including Win Rate, Average R-multiple, Window Drawdown, All-Time Drawdown, and current Streak information to help traders assess system performance in real-time. The Regime Edge metric shows the current statistical advantage in R-multiples, with readings above 0.50R indicating favorable conditions.
Exit Strategy and Trade Management
Close one-third of the position when price reaches TP1 and move the stop loss to breakeven to eliminate risk. Take profits on another third at TP2 while trailing the stop to just below the recent swing high for longs or above the swing low for shorts. Allow the final third to run to TP3 or until the trend line flips color indicating a potential trend change. Exit immediately if the Status changes from Ready to Warning or if the Regime shifts to Mixed/High Vol during the trade as this indicates deteriorating conditions.
The indicator features Character-Flip Detection which identifies when market character changes from trending to mean-reverting or vice versa. When this occurs, the system may generate early exit signals even before price hits stop loss or take profit levels. Traders should respect these signals as the SATS algorithm has detected a fundamental shift in market dynamics that could invalidate the original trade thesis.
Multi-Timeframe Analysis
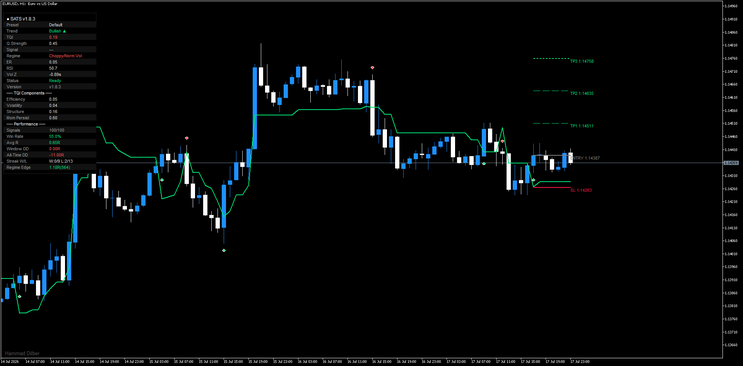
For optimal results, analyze the EURUSD or your chosen instrument across multiple timeframes using SATS. The indicator performs well on M15, M30, H1, and H4 charts as shown in the example screenshots. Higher timeframes like H1 and H4 provide more reliable trend signals with fewer false breakouts, while lower timeframes like M15 offer more frequent entries but require stricter filtering. Align trades in the direction of the higher timeframe trend, so if H4 shows Bullish trend and M15 generates a Bullish signal, the probability of success increases significantly.
The Performance section displays Signals count, Win Rate percentage, Average R-multiple achieved, and current drawdown metrics for the active session. Monitor these statistics to understand how the system is performing in current market conditions. A Win Rate above 50% with Average R above 0.50R indicates the system is functioning optimally, while declining metrics suggest reducing position size or waiting for higher-quality setups.
Market Regime Filtering
The Regime indicator is crucial for trade selection and shows conditions like Choppy/Norm Vol, Mixed/High Vol, Trending, or other market states. Prioritize trades when Regime shows Choppy/Norm Vol or clear Trending conditions as these environments produce the cleanest signals with best risk-reward ratios. Avoid or reduce size in Mixed/High Vol regimes as the increased noise can trigger premature stops and generate whipsaw signals.
The TQI Components section breaks down the overall TQI into Efficiency, Volatility, Structure, and Mom Persist (Momentum Persistence) sub-components. Efficiency measures how directly price moves in the trend direction, Volatility shows current market variance, Structure evaluates the quality of higher-highs and higher-lows or lower-highs and lower-lows, and Mom Persist indicates whether momentum is sustaining or fading. All four components should align favorably for high-conviction trades, with Efficiency and Structure being particularly important for trend continuation setups.
Optimal Trading Sessions and Instruments
SATS performs best on major forex pairs like EURUSD, GBPUSD, USDJPY during London and New York sessions when liquidity is highest and trends are most sustainable. The indicator also works effectively on indices like US100 (Nasdaq) as shown in the screenshots, commodities like Gold (XAUUSD), and select cryptocurrencies during active market hours. Avoid trading during low-liquidity periods like the Asian session for EURUSD or during major news events when spreads widen and price action becomes erratic.
The adaptive nature of SATS means it automatically adjusts band width and sensitivity based on the instrument's historical volatility profile, making it suitable for diverse markets without requiring extensive parameter optimization for each symbol. However, traders should still test the indicator on their preferred instruments during different market conditions to understand its behavior and adjust position sizing accordingly.
Performance Tracking and Continuous Improvement
Maintain a detailed trading journal recording every SATS signal, entry price, stop loss level, take profit targets, exit price, and the reasoning for taking or passing on each setup. Note the TQI value, Regime condition, Efficiency reading, and RSI level at entry to identify which combinations produce the best results in your trading. Review weekly and monthly statistics to identify patterns in winning versus losing trades, and gradually refine your filter criteria to focus on the highest-probability setups.
The indicator's built-in Performance metrics provide real-time feedback on system effectiveness, but personal tracking adds context about execution quality, psychological factors, and market conditions that raw numbers cannot capture. Over time, this data will reveal your personal edge with the SATS system and help you develop intuition for when to trade aggressively versus when to stand aside.
Conclusion
The Self-Aware Trend System represents a sophisticated approach to trend following that adapts to changing market conditions through its multi-factor analysis engine. By combining adaptive SuperTrend bands with the Trend Quality Index, efficiency ratios, momentum persistence, and volume analysis, SATS filters out low-quality signals and focuses on high-probability trend continuation setups. Success with this system requires discipline in following the signals, patience to wait for optimal setups with aligned indicators, and proper risk management through position sizing and adherence to stop loss levels.
Traders who master SATS will benefit from its ability to capture sustained trends while minimizing drawdowns during choppy periods, but like any trading system, it requires consistent application, continuous learning, and realistic expectations about win rates and drawdowns. The indicator provides all the technical analysis needed for entry and exit decisions, but the trader must provide the discipline, risk management, and emotional control necessary for long-term profitability.

152# Awesome, Accelerator and HMA
Trend Momentum Strategy with HMA indicator
Submit by JanusTrader
Time Frame H1
Currency Pairs:all.
Enter long:
1 – Blue Candle;
2 – White AC Bar ( Accelerator Oscillator indicator ) , best if it’s above 0.0 level;
3 – White AO Bar ( Awesome Indicator ) , best if it’s above 0.0 level;
4 – Green Trend Line ( HMA indicator );
Enter Short:
1 – Red Candle;
2 – Red AC Bar ( best if it’s below 0.0 level );
3 – Red AO Bar ( best if it’s below 0.0 level );
4 – Red Trend Line.
TARGET and STOP LOSS
Setting target profit and stop loss is important in trading. It requires a bit experience. So if you are new to trading, you can use the following simple rules:
Place target profit to 30 pips. And set stop loss to be the same.
In the pictures below Trend Momentum Strategy with HMA indicator in action.
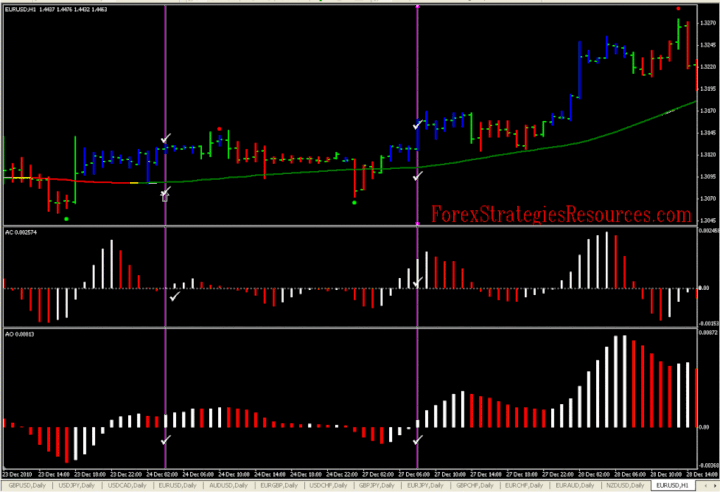
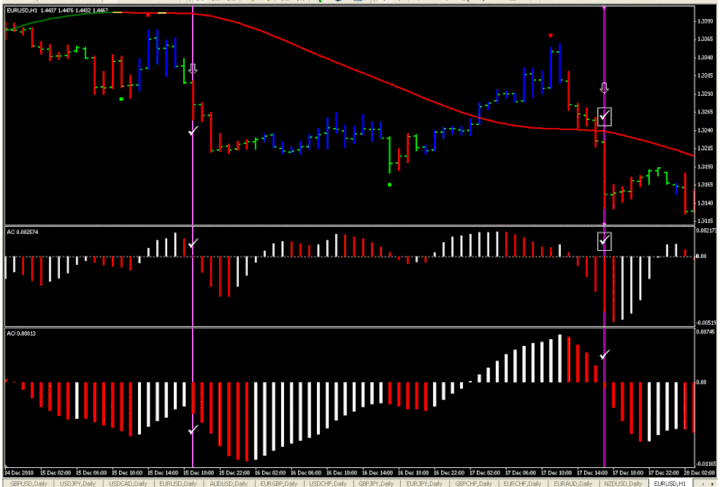
You can use fixed numbers (as above), or support and resistance levels. But here is a great and easy way to set your targets and stop loss…
TARGET: Close trade when you get an opposite signal
STOP LOSS: White/Red Dots ( Shi Signal Indicator ). Shi Signal is an indicator that shows a possible reversal point to a trend. In the example below, you can see that we are about to enter a short trade, and use the previous Red Dot as the stop loss point.
You can apply the same way for long signal (use White Dot).
Awesome, Accelerator and HMA Trading System: Templete and Indicators Mt4
Share your opinion, can help everyone to understand the forex strategy.

Awesome Forex Strategies
12# Parabolic and Awesome - Forex Strategies - Forex Resources
114# Awesome and Bollinger Bands Scalping - Forex Strategies ...
75# Awesome, Stochastic and ADX - Forex Strategies - Forex ...
152# Awesome , Accelerator and HMA - Forex Strategies - Forex
18# Stochastic and Awesome - Forex Strategies - Forex
25# ADX, Awesome and Stochastic Histogramm - Forex
30# Stoch, Awesome and Ema - Forex Strategies - Forex
3# Pin Bar and Awesome - Forex Strategies - Forex Resources ...
173# Awesome - Forex Strategies - Forex Resources - Forex ...
83#Awesome and MACD - Forex Strategies - Forex Resources ...
32# AC,AO and Stochastic - Forex Strategies - Forex Resources ...
