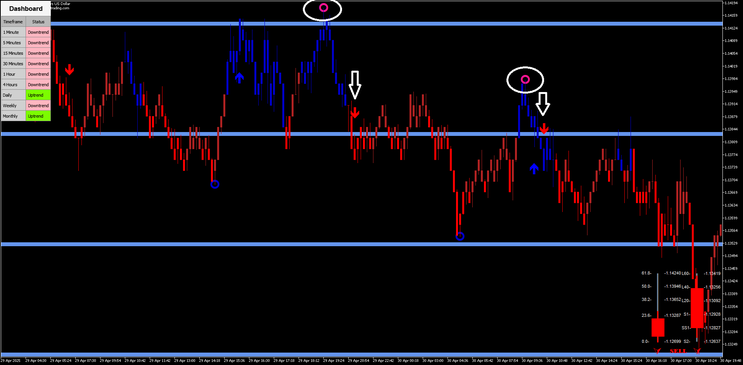
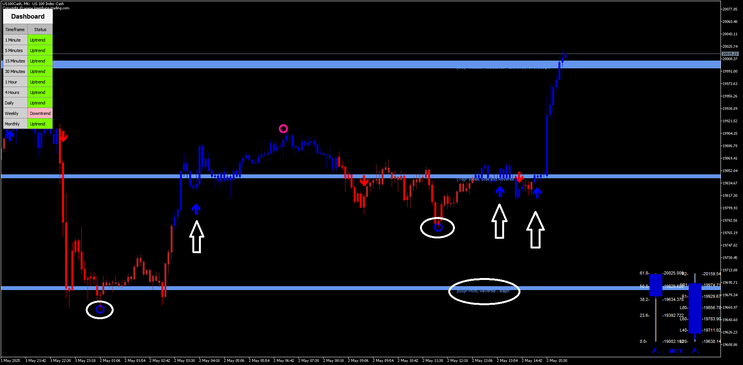
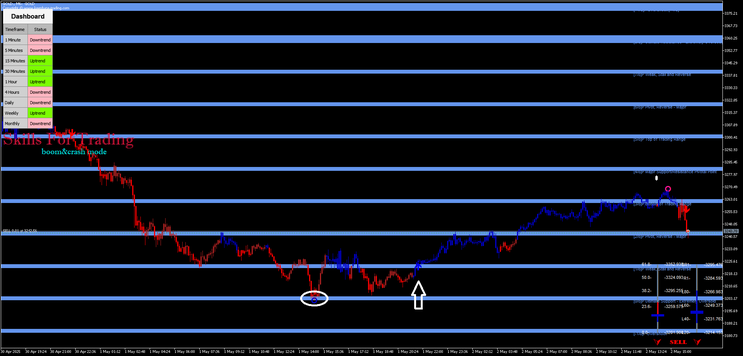
157# Spike Master Trading Strategy MT5: Spike + Level + Arrow (Trend-Aligned Entry)
Dimitri 2025
To enter high-probability trades after a spike occurs, but only when price is near a key level (support/resistance) and a confirmation arrow appears in the direction of the higher-timeframe trend. This triple-confirmation method improves accuracy and minimizes false signals.
Setup
-
Platform: MetaTrader 5 (MT5)
-
Timeframe: M6 (6-Minute Chart)
-
Indicators Used:
-
SpikeMaster Pro (Spike circles),
-
Trend Dashboard (Multi-timeframe trend status),
-
MACD color default setting,
-
SR levels (Murray Math) default setting,
-
Fibopivot Candle bar
-
Arrow
-
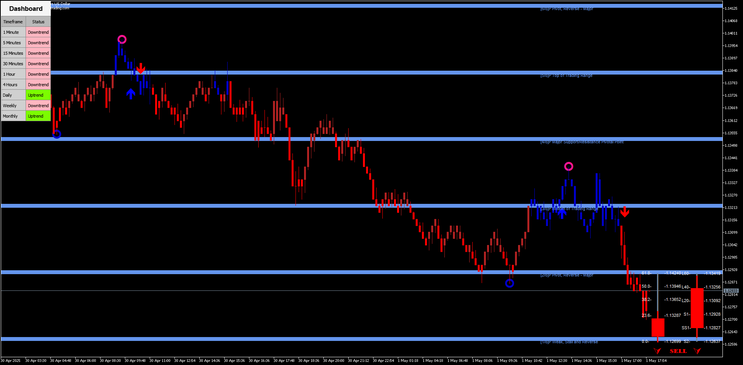
BUY Setup
✅ Entry Rules:
-
A blue spike circle appears below price (indicating a bullish spike).
-
Price is close to or touching a support zone (highlighted in blue).
-
The Trend Dashboard shows Uptrend on at least 1-2 higher timeframes (e.g., H1, H4, Daily).
-
A blue upward arrow appears after the spike, while price is still near support.
🎯 BUY Entry: Open a buy trade as soon as the blue arrow appears, only if the price is still near the support zone.
📤 Exit Rules:
-
Take Profit: At the next resistance zone or 50–61.8% Fibonacci retracement level.
-
Stop Loss: Just below the low of the spike (blue circle) or the support zone.
SELL Setup
✅ Entry Rules:
-
A red spike circle appears above price (indicating a bearish spike).
-
Price is near or touching a resistance zone.
-
The Trend Dashboard shows Downtrend on higher timeframes (e.g., H1, H4, Weekly).
-
A red downward arrow appears after the spike, while price remains near resistance.
🎯 SELL Entry: Open a sell trade when the red arrow appears, only if price is still near the resistance zone.
📤 Exit Rules:
-
Take Profit: At the next support zone or 0–23.6% Fibonacci level.
-
Stop Loss: Just above the spike high (red circle) or resistance zone.
Additional Notes
-
Avoid entries if price has already moved far from the level before the arrow appears.
-
Use this strategy on Deriv’s Boom/Crash indices or major Forex pairs.
-
Avoid low liquidity periods and news events.
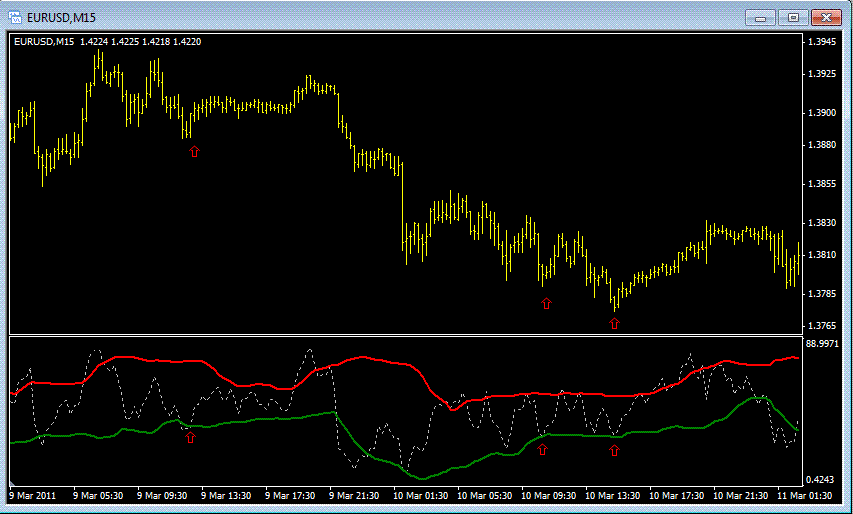
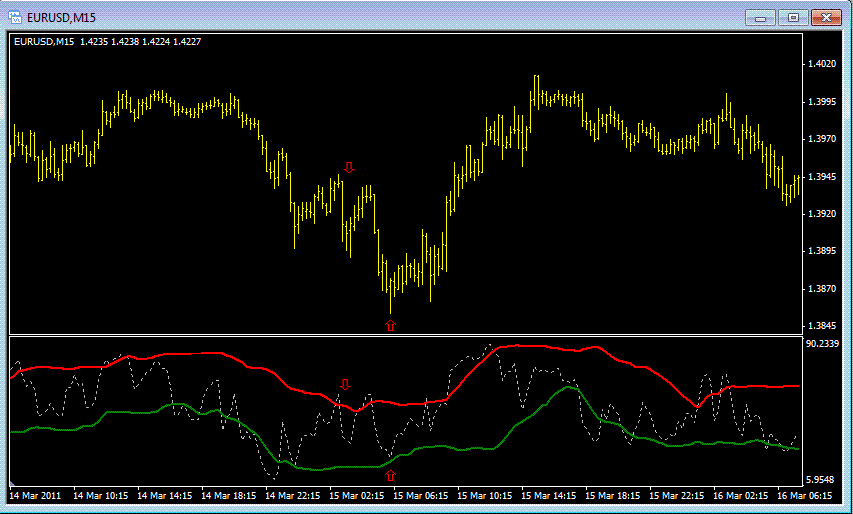
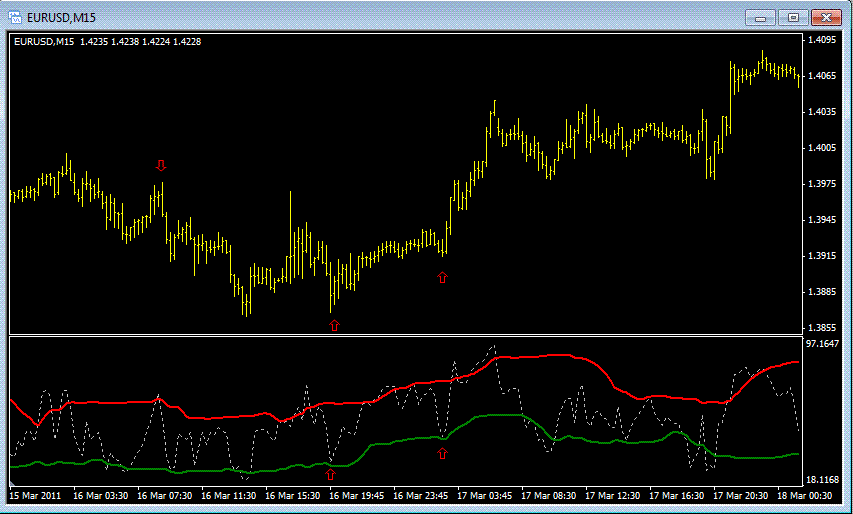
Fx Night Trading System
Submit by JanusTrader
Time Frame 15 or higher.
Currency Pairs: all.
Indicators:
Fx Night
FX Night uses overbought\oversold calculation to generate its signals. In the main trading screen you can see the main indicator line – the silver line in the middle, and the upper and lower boundaries in green and red.
First filter is to take signals only in the directions of the channel. If the channel is going upwards take only long trades. If the channel is going downwards take only short trades.
LONG SIGNAL is generated when the main line crosses the red line from below.
SHORT SIGNAL is generated when the main line crosses the green line from above. You can also take the trade if the main line doesn’t actually cross the line, but just touch it and bounces.
Exiting Trades
Exit long trade when the lower line (Green) is going down.
Exit short trade when the upper line (Red) is going up.
FX Pips
In the pictures FX Night forex system in action.