211# How to Filter a Pullback in Trading
Valid Pullback Indicator MT5, MT4.
Pullbacks are among the most powerful trading opportunities, especially when aligned with the dominant market trend. However, not every pullback is worth trading: some are strong continuation signals, while others are just noise or even reversals. To improve accuracy, traders need a filtering process that separates high-probability pullbacks from weak ones.
1. Use the Trend as a Filter
The first and most important rule is to only trade pullbacks in the direction of the main trend.
-
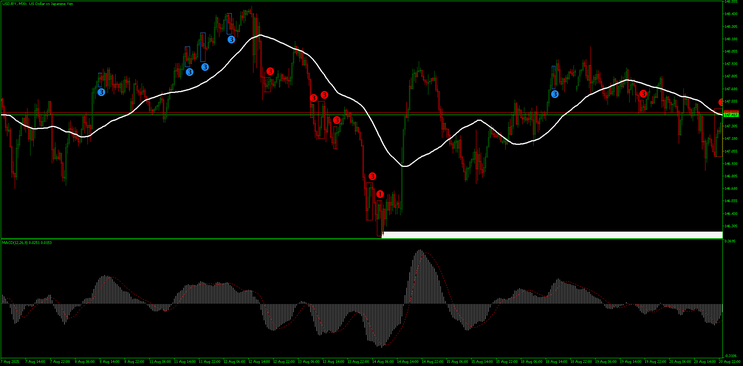
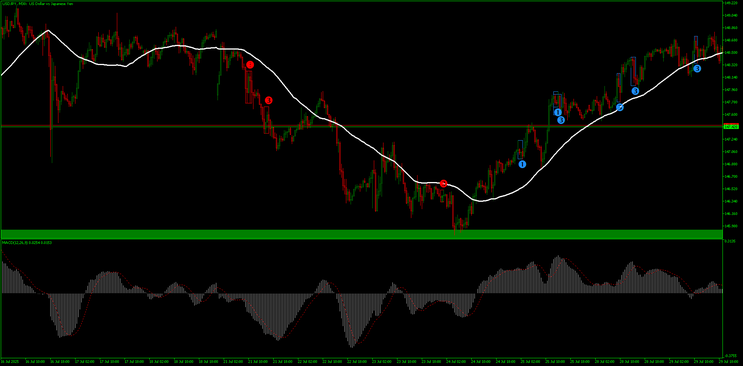
Apply a moving average (e.g., 50 EMA or 200 EMA).
If price is above the moving average → focus on long pullbacks.
If price is below the moving average → focus on short pullbacks.
This simple filter helps eliminate trades that go against momentum.
2. Confirm with MACD or Momentum Indicators
Momentum confirmation reduces false entries.
-
For long pullbacks: MACD should be above the zero line or showing a bullish crossover.
For short pullbacks: MACD should be below the zero line or showing a bearish crossover.
This ensures that the market still has energy in the direction of your trade.
3. Rely on Support and Resistance
Not all pullbacks occur at meaningful levels. A pullback that respects a strong support or resistance zone has much higher reliability.
-
Look for pullbacks to round numbers, Fibonacci levels, trendlines, or previous highs/lows.
Avoid trades in the middle of nowhere without clear structure.
4. Validate with Price Action
Price action is a strong confirmation tool. Even if an indicator shows a pullback, wait for a candlestick pattern that signals rejection.
-
Bullish pin bars, engulfing patterns, or dojis at support confirm a long pullback.
Bearish engulfing or shooting stars at resistance confirm a short pullback.
5. Consider Volatility (ATR Filter)
Low-volatility pullbacks often fail. Use the Average True Range (ATR) to filter setups:
-
Enter trades only when the move has enough range compared to the ATR.
If the pullback is too shallow (less than half ATR), it might not be worth the risk.
-
Valid Pullback indicator MT5, MT4.
Max 2 trades in the same direction.
211# MTF Trend Pullback Trading System
Heiken Aschi and Gann Hilo Trading system
Submit By Joy22 (Written by Jesper Weber [email protected] )
SYNOPSIS
The system described is a trend-following system on a slow timeframe that uses optimized (that is, contrarian) entries and exits on a fast timeframe at the tops and bottoms of retraces against the overall trend. Instead of trying to pick tops and bottoms at the beginning and end of major trends, multiple entries are made after the trend has been established with confidence.
The system is in the market only when the currency pair is in a well-confirmed trend. There is no stop-and-reverse logic keeping the system in the market at all times (although a trade in the opposite direction of the trade just closed may be entered immediately if all conditions are met).
The trend chart has the following indicators:
Heikin-Ashi, with optional alert arrow
Gann High/Low (box size 10) as dots and/or line
2-Bar High/Low to show recent support and resistance (optional)
Stochastics (13,3,3), fixed low of 25 and fixed high of 75, center line at 50 (optional)
MACD (5,13,3), center line at 0 (optional)
Bollinger Bands (55 period, 1/2/3 deviations) (optional)
The entry chart has the following indicators:
Heikin-Ashi, with optional alert arrow
Gann High/Low (box size 5) as dots and/or line
Stochastics (13,3,3), fixed low of 25 and fixed high of 75, center line at 50
2-Bar High/Low to show recent support and resistance (optional)
MACD (5,13,3) , center line at 0 (optional)
Bollinger Bands (21 period, 1/2/3 deviations) (optional)
The exit chart has the following indicators:
Heikin-Ashi, with optional alert arrow
Gann High/Low (box size 5) as dots and/or line
MACD (5,13,3), center line at 0
2-Bar High/Low to show recent support and resistance (optional)
Some of the indicators on the shorter entry/exit timeframes are set to faster values than those on the longer trend timeframe. This makes them more sensible to retracements and reversals, resulting in more trade opportunities.
The exit chart has a different background color from the trend and entry charts. When I enter a trade, I simply switch the template on the short-term chart from my entry template to the exit template. Thus I have an immediate visual clue on which pair and which timeframe I am currently holding a position. I also draw a horizontal line at the entry price to help me see how the trade develops, and whether the Gann dots have already moved into profit territory.
4. ENTRY RULES
This system uses a combination of lagging indicators for entries. Lagging indicators are a representation of the past, not a reliable prediction of future price action. Interpretation of the behavior of the (combined) indicators, a look at the total picture by the trader is therefore something I find an integral part of any trading “system” – maybe “approach” is a better word.
The rules of this system can be used to make strictly mechanical entries and exits. I personally prefer to leave the final decision to trader discretion and common sense. I also do not take signals when major news releases are about to come out; on the other hand, I am quite happy to take signals immediately after news has reinforced or changed the overall fundamental picture – that is when big moves happen, and happen for a reason.
To enter:
I check the filter on the trend timeframe:
For long trades, Heikin-Ashi must be blue and above the Gann High/Low
For short trades, Heikin-Ashi must be red and below the Gann High/Low
I check for a signal on the entry timeframe:
For long trades, Heikin-Ashi must be blue and above the Gann
STOP-LOSS RULES
I set a hard stop-loss beyond recent support or resistance on the long-term trend timeframe. The optional 2-Bar High/Low indicator helps me identifying those zones, and I also take a look at recent price action to confirm.
In general, I close a position if either of the below conditions is met:
Only in profit when a reverse signal happens on the short-term entry/exit timeframe, meaning: Price pierces and closes on the opposite site of the Gann resistance/support, visually confirmed by the Gann dot disappearing and/or an opposite dot appearing.
In profit or loss if the trend reverses on the long-term trend timeframe, meaning: On a closed candle Heikin-Ashi reverses color and the Gann resistance/support dotted line is broken.
If I have added positions to my initial position, I treat them as individual trades. In other words, if all positions are already in profit and I get an exit signal on the fast timeframe, I close them all. If any positions are not in profit yet, they are only closed if the trend reverses on the slow timeframe.
There is something peculiar about the Gann High/Low indicator which sets it apart from other support/resistance indicators like DeMark or PSAR: the dot does not flip just when a spike touches them, but only if the candle closes beyond it. Therefore I do not like to place stop orders where the dot is, but instead check what happens when the next candle forms. If I cannot sit at the PC and actively manage my trade, I will – depending on where the trade is at – either hedge the position or place a stop at the long-term Gann dot or the short-term Gann dot three candles back (only if that dot is already in the profit zone of the trade); this, again, is a discretionary element of my trading style.
TARGET-PROFIT RULES
I do not set a target to close the initial position, instead I wait for a clear reverse signal to close the position or my – trailed – stop to be hit.
Doing so has some distinctive advantages:
With the final stop being a reversal of long-term trend, the pip-distance can get very large. Taking out successful trades early or trailing stops too closely quickly results in a bad risk/reward ratio (penny-wise and dollar-foolish). Holding the trade unless a reverse signal is generated forces me to let my profits run.
Most importantly, when I exit on the short-term chart while the long-term trend is still intact, only having the short-term signals reverse against the trade guarantees me that I will have re-entry signals later if the long-term trend continues.
For added positions only, I sometimes set discretionary targets at or before the closest support (for long trades) or resistance (for short trades) zones in order to lock in profits and to avoid subjecting the trade to whipsaw around those zones.
ADDING POSITIONS
I only enter into more positions if my initial and all consequently added positions are in profit and risk-free.
The add-on signal can never be the same as the initial entry signal – receiving
an initial signal means that the indicators had reversed during a retracement before and the initial position was closed. I am essentially looking for minor retracements against the trend, not large enough to close my existing positions and wait for a fresh entry, but also not too small to generate a clear signal.
To add a position:
I check that the trend has not been broken on the trend chart
I make sure all existing positions on the pair are in profit and risk-free, with a hard stop-loss trailed into the profit zone
Heikin-Ashi and Gann High/Low conditions must be met on the short-term exit chart
For long add-ons, MACD must cross below the 0 line or turn from red to blue when already below the 0 line
For short add-ons, MACD must cross above the 0 line or turn from blue to red when already above the 0 line