


214# SAR Fusion Method Trading Strategy
Alexander 2025
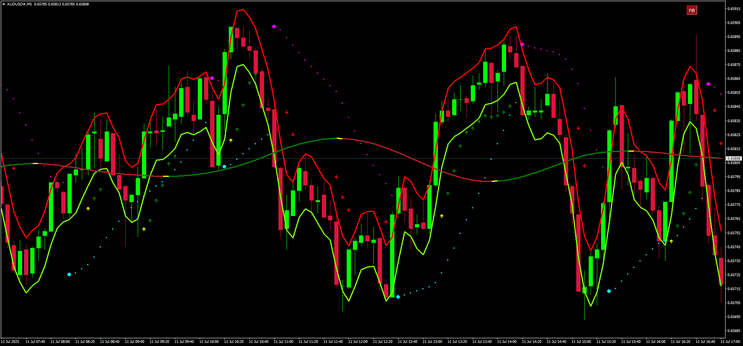
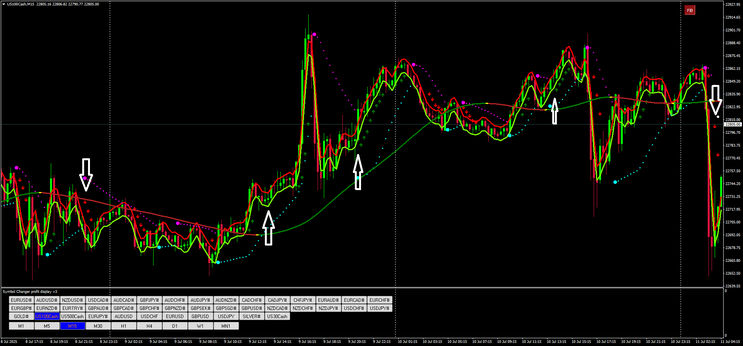
The SAR Fusion Method is a trend-following and momentum-based intraday strategy designed for use on the MetaTrader 4 (MT4) platform. It leverages a combination of indicators—Parabolic SAR, Envelopes, FX Trend Finder Arrow, and a Filter Ratio trend filter—to generate high-probability entries in the direction of the prevailing trend. Suitable for all currency pairs and adaptable across multiple time frames, it excels particularly well on the 5-minute chart for scalping and short-term trading.
Setup
-
Time Frame: 5 minutes or higher (M5 recommended)
Currency Pairs: Any (preferably with low spread and high liquidity like EUR/USD, GBP/JPY, AUD/USD)
Platform: MetaTrader 4
Indicators
-
Filter Ratio 60 Period – used to determine the overall trend direction (acts as a dynamic trend filter)
-
Envelopes
-
Period: 3
Deviation: 0.03
Used to detect overbought/oversold levels and short-term reversals
-
-
FX Trend Finder Arrow (Default Settings)
-
Provides directional bias and entry confirmation
-
-
Parabolic SAR (Default Settings)
-
Confirms momentum and entry/exit timing
-
Trading Rules
Buy Setup
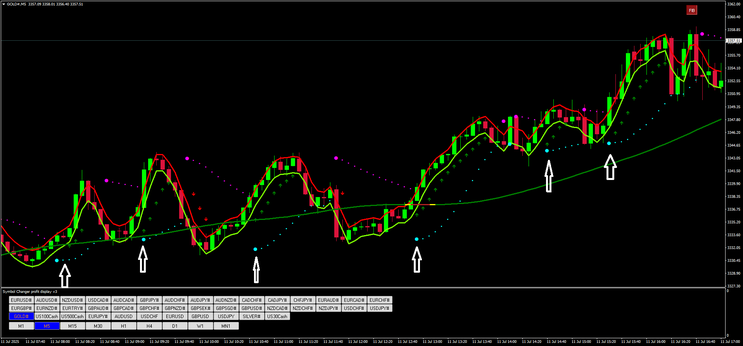
Enter a long (buy) position when the following conditions are met:
-
Filter Ratio line is sloping upward – indicates bullish trend.
-
Price touches or slightly dips below the lower Envelopes band – signifies short-term oversold condition.
-
Parabolic SAR dot appears below the current candle – momentum shifts to the upside.
-
Green FX Trend Finder arrow appears below the candle – confirms bullish signal.
Optional Confirmation:
-
A strong bullish candlestick (e.g., bullish engulfing or marubozu) forms near the envelope band.
Sell Setup
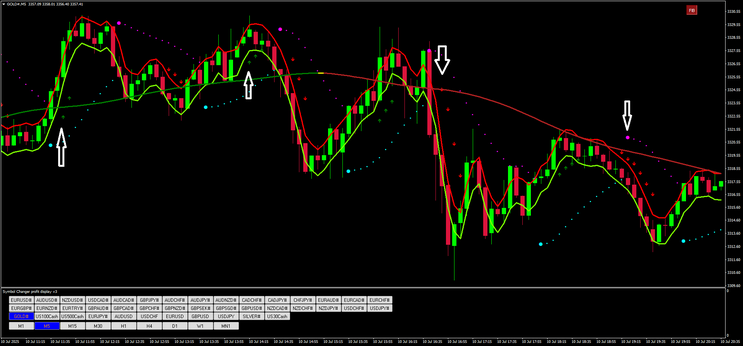
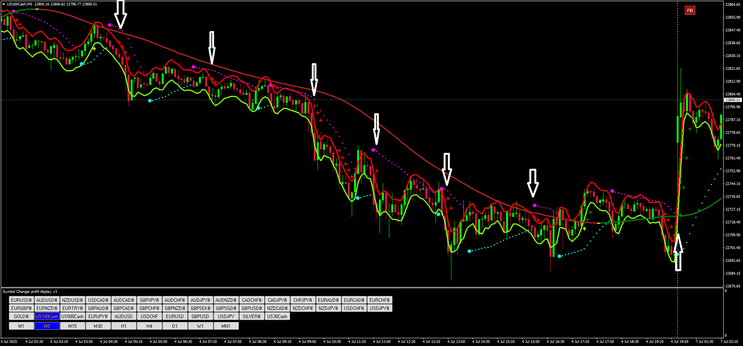
Enter a short (sell) position when:
-
Filter Ratio line is sloping downward – bearish trend.
-
Price touches or slightly exceeds the upper Envelopes band – short-term overbought condition.
-
Parabolic SAR dot appears above the current candle – momentum shifts downward.
-
Red FX Trend Finder arrow appears above the candle – confirms bearish signal.
Optional Confirmation:
-
A strong bearish candlestick pattern near the upper envelope.
Exit Rules
-
Stop Loss:
-
Place below the recent swing low (for buy) or above the swing high (for sell)
Or use opposite side of the Envelopes band for a tighter stop
Take Profit:
-
Fixed risk-to-reward ratio (e.g., 1:1.1 or 1:1.2)
Or exit on opposite signal from Parabolic SAR and FX Trend Finder Arrow
Trail stop using SAR dots for trend-following
-
Note: Expert Rule
Advanced traders may choose to simplify
the system by using only Parabolic SAR, the Filter Ratio trend indicator, and Envelopes, while still following the same filtering conditions for trend direction and entry points. This streamlined
setup retains the core logic of the strategy and is suitable for those who prefer a cleaner chart or already have experience interpreting price action.
Conclusion
The SAR Fusion Method combines trend detection and precise timing through a synergistic use of Envelopes, Filter Ratio, Parabolic SAR, and FX Trend Arrows. It offers traders a clear, rule-based approach with visual confirmation for confident entries and exits. Consistent use of this strategy with proper risk management can improve decision-making and reduce false entries in ranging markets.
214# The Wallaby Trade Trading System
Three Stochastic trading method
Submit by JanusTrader
KPeriod = 7 Sets %K period for the three Stochastics
DPeriod = 3 Sets %D period for the three Stochastics
Slowing = 3 Sets smoothing average period for three Stochastics
Timeframe1 = 1, Timeframe2 = 5, Timeframe3 = 15 Configures the timeframe used to calculate every Stochastic indicator. Use 60 for 1 hour charts, 240 for 4 hours charts, 1440 for daily charts, 10080 for weekly charts and 43200 for monthly charts.
Based on the classic stochastic oscillator, this indicator has been set to average over three time periods, in an attempt to detect counter trade trades; however, the basic concept is to understand those movements as pullbacks that gave buying opportunities on deeps, favoring the trend trading.
The Stochastic Oscillator is set to 7,3,3 with levels at 20 and 80 to signal extreme readings, and based in short time frames by default. To trade in bigger time frames, the parameters need to be adjusted.
By itself, the indicator should give traders a warning sign of market entry once the price and the Wallaby are divergent, although it needs a filter that in fact generates the buy/sell signal.
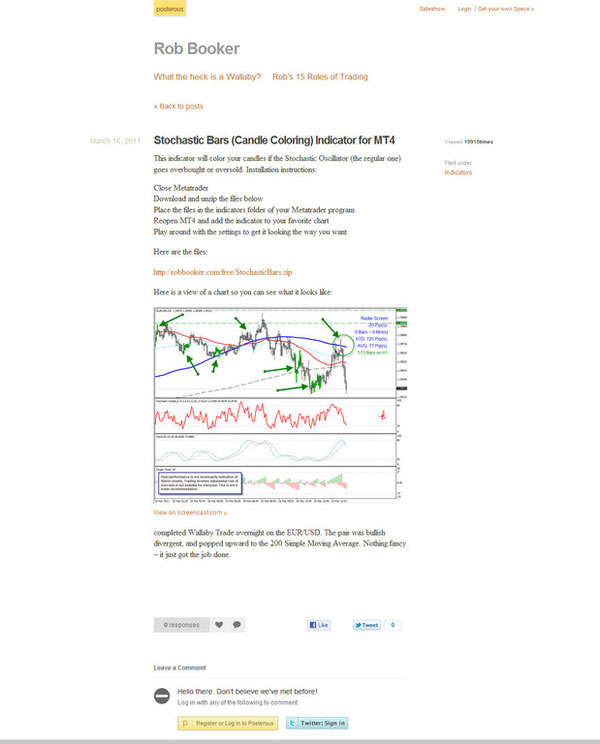
Also, and as a classic Stochastic, cross over outside the extremes tend to signal exhaustion conditions and signal a reversal in the current dominant trend, accordingly to the chart under study: take a loot at the following USD/JPY 15 minutes chart.
A bit hard to read and understand at the beginning, yet simple when you dominate it; maybe not revolutionary, yet no doubts another of Rob Booker’s great trading tool.
Share your opinion, can help everyone to understand the forex strategy.
