


223# Color Filter Trend Strategy
Janus Trader 2025
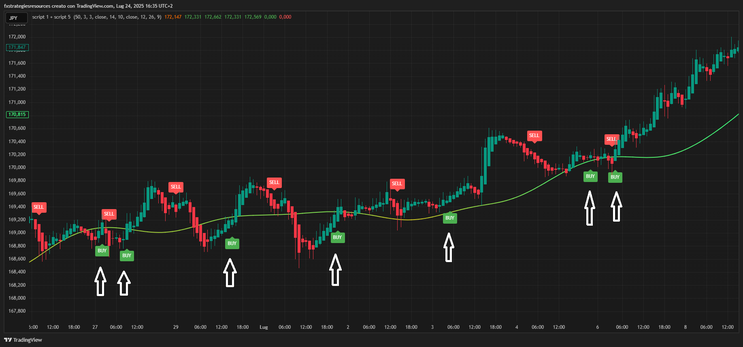
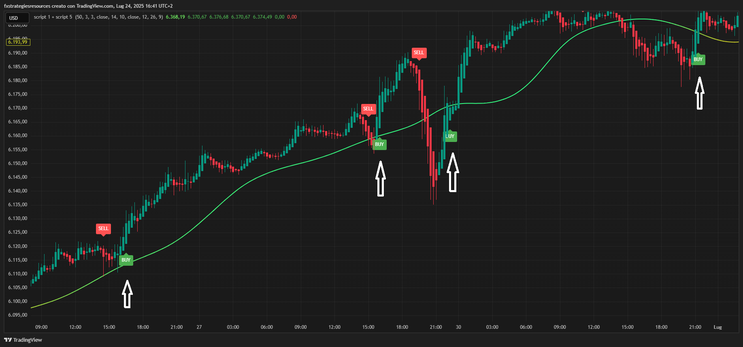
The Color Filter Trend Strategy is a simple yet powerful visual strategy based on a color filter indicator. The line acts as a smoothed trend filter with a color gradient from red (downtrend) to green (uptrend). Buy/sell signals are generated only when the line shows a clear trend change through color and direction changes.
Setup
Platform: TradingView
Timeframe: 15 minutes or higher
Markets: Any (Forex, Crypto, Stocks, Indices, etc.)
Indicators Used:
-
Color Gradient Line Filter: A custom smoothed line that shifts color:
-
Red shades = Bearish pressure
Green shades = Bullish momentum
Yellow/Orange = Transition phase or weaker signals
Colored Candlesticks: For additional trend visualization (green = bullish, red = bearish)
-
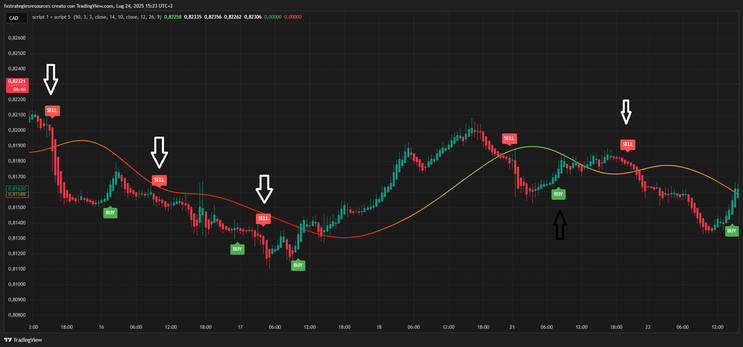
Buy Entry Rules
Enter a Buy trade when the following conditions are met:
-
The filter line starts curving upward
-
The line color shifts from red/orange to green shades
-
A BUY label appears below the candle
The green color and upward slope indicate increasing bullish momentum.
Sell Entry Rules
Enter a Sell trade when the following conditions are met:
-
The filter line starts curving downward
-
The line color shifts from green/yellow to red shades
-
A SELL label appears above the candle
The red color and downward slope indicate growing bearish strength.
Aggressive mode only TF 30 and higher.
Another way to interpret this indicator:
Buy
Price close above the line with a green candlestick (buy).
Sell
Price close below the line with a red candlestick (sell).
Exit Rules
For Buy Trades:
-
Exit when a SELL label appears
Or when the filter line flattens or turns downward and its color fades to orange/red
For Sell Trades:
-
Exit when a BUY label appears
Or when the filter line flattens or curves upward and its color shifts to green
Conclusion
The Color Filter Trend Strategy is ideal for traders who want a clean, visual way to follow trends. By relying on both the direction and color of the filter line, traders can avoid false signals during sideways markets and trade only when momentum is aligned.
It works best on timeframes of 15 minutes or higher and can be applied to any trading instrument. No ADX or MACD is visible on the chart — all decisions are based on the dynamic filter line and the BUY/SELL labels.
Pips Flush Trading System
Submit by Janus Trader
Time Frame 15 min or higher
Currency pairs:any
INDICATORS DESCRIPTION
The indicators used were sub-divided into two different types, they are:
a.) Main Chart Indicators
b.) Expert Indictors
a.) Main Chart Metatrader Indicators
Template indicators used in this strategy are listed below:
EMA 50 LIGHT CYAN (COLOR)
WC HOI HOIKEN HAS
BOLLINGER BAND
WEMA CROSSOVER
WTF (TREND FOLLOWER)
WCLOCK TELLER
WFFCAL (FOREXFACTORY CALCULATION)
WFP (FIBONNANCI PIVOT)
WHAS EXIT
WST (SPREAD TELLER)
ZONE IDENTIFIER
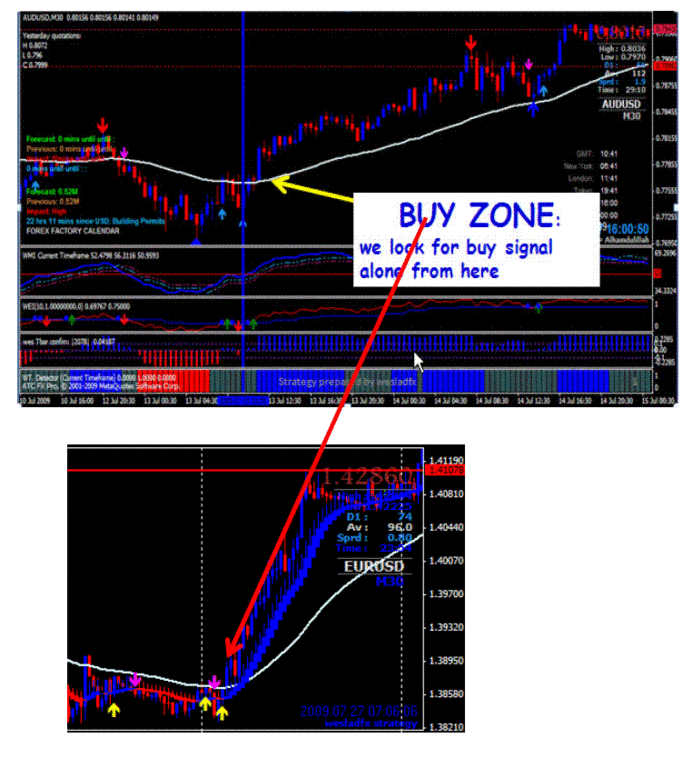
Zone identifier means ability of a trader to determine the type of zone market is moving and for the
sake of this strategy we make use of 50 exponential Moving Averages.
In this Strategy we consider two different types of Zones.
a.) Buy Zone
b.) Sell Zone
BUY ZONE
We have Buy Zone whenever we have price above 50 E.M.A, so after this all we will be
thinking of this as a Buy signal only
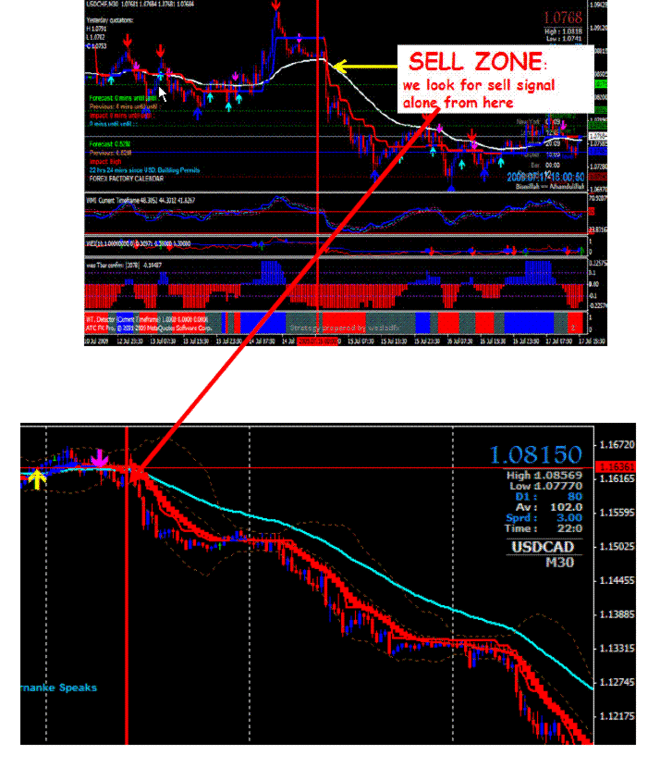
SELL ZONE
We have sell Zone whenever we have price below 50 E.M.A, so after this all we will be thinking of
this as sell signal only


BASIC RULES FOR ENTERING TRADES
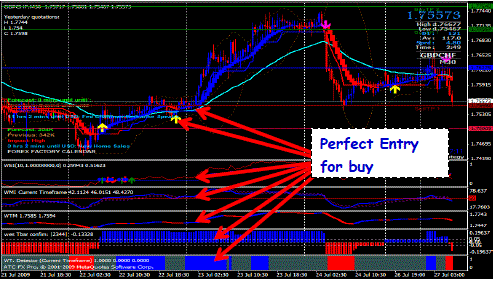
Buy Entry
The following conditions must meet before placing a buy trade and they are listed below:
• Price must have closed above 50 E.M.A
• WEMA must generate an ARROW for BUY
• WTM must be blue
• WMI BLUE line must crossed above 50 level
• Wes Tbar confirms & WT.Detector both must turn blue at the close of candle above 50 EMA.
After the Price has closed above 50EMA, Should in case the price has moved up by 20pips up, It´s
recommended that we should wait for a re-test of 50ema line back then after the re-test we buy to avoidentering at Retracement. Or we do this by placing pending buy limit order at the 50EMA level.
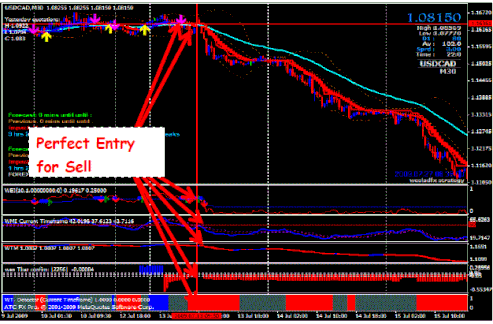
SELL ENTRY
Below are conditions to enter a sell trades, they are:
• Price must have closed below 50 E.M.A
• WEMA must generate an ARROW for SELL.
• WTM must be RED
• WMI BLUE line must crossed below 50 level
• Wes Tbar confirms & WT.Detector both must turn RED at the close of candle above 50 E.M.A.
Important:
After the closed below 50EMA,and in case the price has moved down to 20pips down, It´s
recommended that we should wait for a re-test of 50ema Line up then after the re-test we sell to avoid
entering at Retracement. Or we do this by placing a pending buy limit order at the 50EMA level
BASIC RULES FOR EXIT
• Exit One: Placing of protective stop loss
• Exit Two: Placing of take profit
• Exit Three: Strategy exit
EXIT ONE – Placing of protective Stop Loss
Protective stop loss is the % of loss you want to afford by a trade that you open and in other terms it’s
called real stop loss or account protector.
This is done by placing a stop loss, we do this by adding 10-15pips to the low of candlestick that cross
the 50EMA up or down depending on the type of market directions.
This typical diagram represent a stop loss placing in a buy market, if you notice you will see that stop
loss is just placed 20pips below 50 EMA which is later the equivalent to 35pips. Here what we are
saying is that a protective stop loss is 35pips that do not mean that you cannot exit your trade before
your protective stop loss is hit.Generally, stop loss should be placed 20-30pips below 50EMA.
EXIT TWO – Placing of Take Profit
This is the most interesting part of the strategy; I like the Strategy because it supports the Rule of
trading that says:
“CUT LOSS SHORT, LEAVE PROFIT TO RUN”.
• This strategy gives the Trader the ability to hold trade over a period of time or even days if market is
trending.
• Short time trader: take profit of 50pips
Trendriders people like us use the following ways to take profit, they are described below:
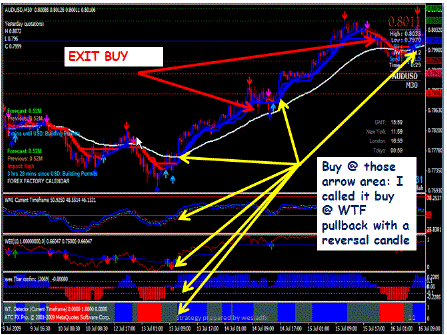
• Firstly, we moved our stop loss to breakeven after gaining 50pips then after that I’m in the condition
of nothing to loose, then we will focus our attention and be looking at WTF(WESLAD TREND
FOLLOWER).
• I will only close my trade if price closed below WTF if I’m in uptrend or closed above it if I’m in
downtrend.
• I will only close my trade if I see a counter signal from WEMA
EXIT THREE - Strategy Exit
This exit three is one of the most important aspects of the strategy because it gave you a signal of what
will happen in the market, this strategy doesn’t´ usual hit a stop loss if the user has a good knowledge
of it, when buying. The strategy may give a buy exit signal which means that you should close your
buy trade immediately and wait for the next action such as exit signals are showen with the following indicators:
1.) WTF Weslad trend follower indicator
2.) WEI Weslad exit indicator
3.) WMI Weslad momentum indicator
SUMMARY ON THEIR USAGE
• We can exit our trade whenever price close below WTF if we are in buying zone and if price
closes above WTF if we are in sell Zone.
• We can exit our trade whenever WEI generate counter trend arrow as a result of blue lines
crossing red line in any trade direction.
• WMI is another tool that we can exit our trade based on whenever it crossed above its 50 line to
give counter trade signal.
88# Riding The Trend after Retracement - Forex Strategies - Forex
12# Bollinger Bands and Fibonacci Retracement - Forex
29# MACD Retracement - Forex Strategies - Forex Resources ...
43 # ForexScalp Retracement - Forex Strategies - Forex
61# The Retracement Market Method - Forex Strategies - Forex ...
76# EMA's Retracement - Forex Strategies - Forex Resources ...
49# CCI and Stochastic Retracement - Forex Strategies - Forex ...
13# Parabolic SAR and Fibonacci - Forex Strategies - Forex ...
82# Ema's and MACD - Forex Strategies - Forex Resources - Forex
37# ADX and EMA - Forex Strategies - Forex Resources - Forex ...
26# Scalping Witn Parabolic Sar and CCI - Forex Strategies - Forex ...
302# CCI 50 Strategy - Forex Strategies - Forex Resources - Forex
7# Macd and CCI - Forex Strategies - Forex Resources - Forex ...
