191# Cluster Path Indicator: A Machine Learning-Driven Breakthrough in Market Structure Analysis Unlocking Adaptive Trend Channels with Rolling K-Means Clustering - MT4, TradingView -
Janus Trader 2025
The ClusterPath indicator marks a radical shift in technical analysis by applying machine learning logic—specifically rolling K-means clustering—to transform raw price data into dynamic, adaptive trend channels. Unlike traditional indicators, which rely on fixed mathematical formulas, ClusterPath groups price action into live statistical clusters, revealing market structure zones that shift with volatility.
Originally developed on TradingView, this version has been ported to MetaTrader 4 (MT4), making its sophisticated clustering logic available to Forex traders and EA developers alike.
Core Mechanics: How ClusterPath Decodes Market Structure Rolling K-Means Clustering
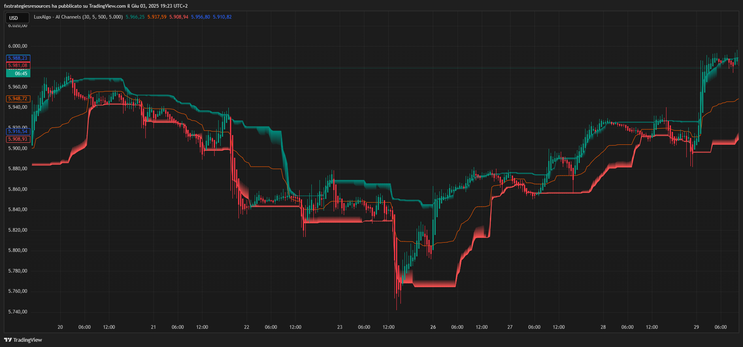
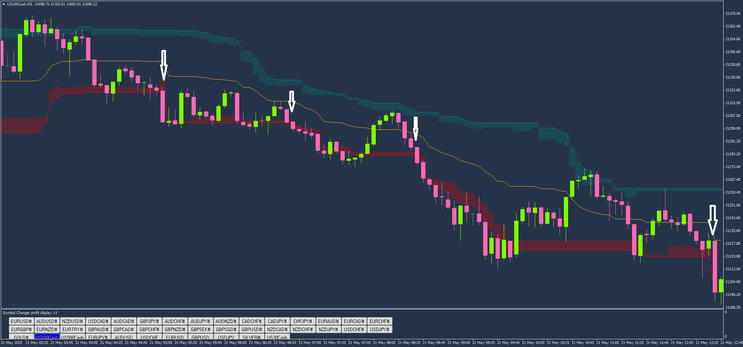
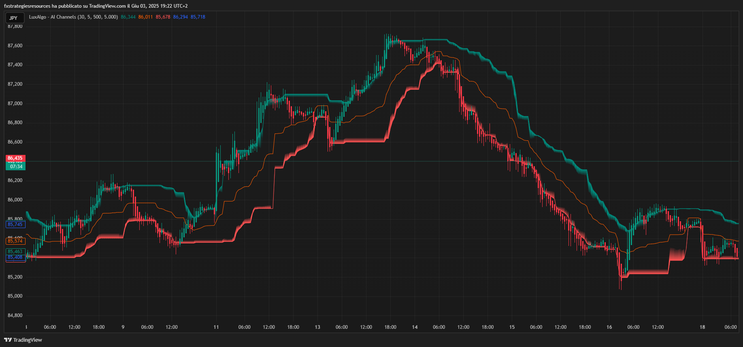
At its core, ClusterPath analyzes a rolling window of price data (e.g., last 30 candles), then dynamically assigns price points into clusters based on their proximity. The algorithm calculates centroids and forms statistical bands around them, creating three critical zones:
Means Clustering
At its core, ClusterPath analyzes a rolling window of price data (e.g., last 30 candles), then dynamically assigns price points into clusters based on their proximity. The algorithm calculates centroids and forms statistical bands around them, creating three critical zones:
Upper Zone (Resistance)
Middle Zone (Median Path)
Lower Zone (Support)
These zones are not fixed — they adjust in real-time to market volatility, allowing traders to assess market regime and directional bias without lag.
How to Use ClusterPath for Trading
ClusterPath supports both trend-following and mean-reversion strategies, depending on the market context and cluster sensitivity settings.
Trend-Following Strategy
Signal Logic:
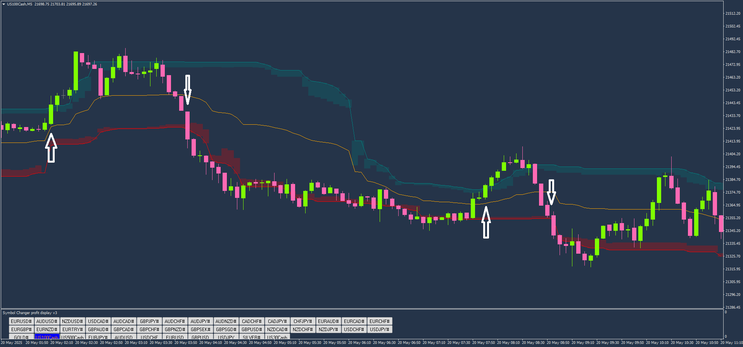
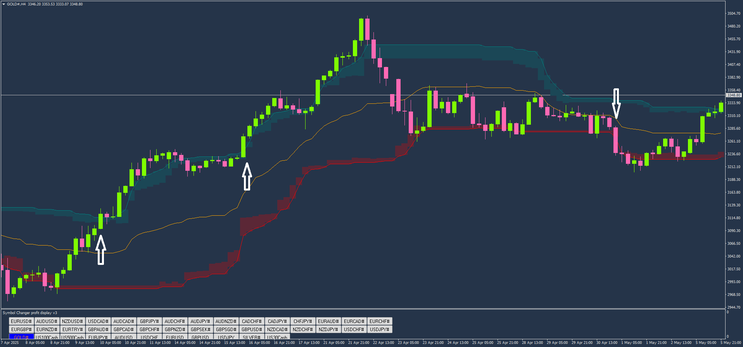
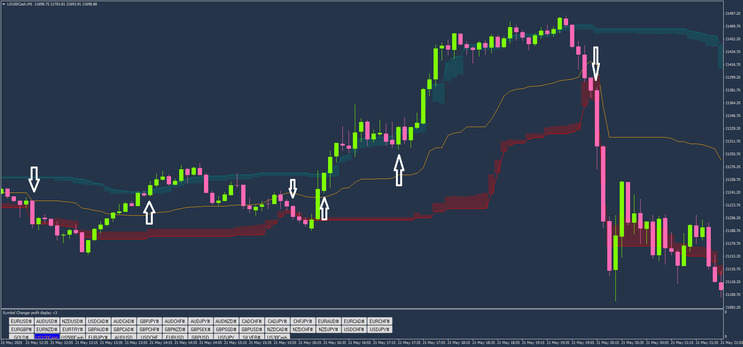
Bullish Breakout: A candle closes above the upper zone, and the middle zone is rising → Enter a long trade.
Bearish Breakdown: A candle closes below the lower zone, and the middle zone is falling → Enter a short trade.
Exit:
Enable Trailing Stop Mode:
For long trades: Exit if price closes below the lower zone.
For shorts: Exit if price closes above the upper zone.
This approach adapts automatically to volatility spikes, making it ideal for trending environments, such as during NFP releases or macroeconomic events.
Mean-Reversion Strategy (Forex Focus)
In Forex markets, where price often oscillates within ranges, ClusterPath becomes a powerful tool for mean reversion, especially when increasing the cluster sensitivity:
High Sensitivity Setting (e.g., Cluster = 8–10):
This widens the outer zones.
Signals are triggered only when price reaches extreme volatility points.
Setup:
Wait for price to touch or spike through the upper/lower zone.
Look for reversal confirmation (e.g., pin bars, engulfing patterns).
Entry: Long from lower zone; short from upper zone.
Target: Middle zone (statistical mean) or opposite band.
This setup works best in non-trending or oscillating pairs (e.g., EUR/CHF, AUD/NZD).
By combining quantitative clustering with intuitive visual zones, ClusterPath bridges the gap between statistical modeling and practical trading execution.