


377# 3 Trades System Trading System
Submit by Janus Trader 17/07/2012
This is the heart of the system and the instructions for the 3 trades that you want to make each day.
Step 1: Open up your MT4 platform each morning after 5am EST but before 7am EST and on the small chart on the Right with the time frame set to 1hour, manually move (double left click to grab the line) the top GREENhorizontal line to the high of the candle between Midnight EST and 5am est.
Step 2: Move the RED horitontal line to the low of the candle between Midnight EST and 5am EST.> That is the candle that opens at 4am est and closes at 5am est.
If you can not find the 2 lines on your DAILYSETUP chart you just need to change the time frame to weekly to see the 2 lines. Then just move them to "around" the current price and change back to the 1 hour time frame to actually plot the 2 lines
per these instructions. The two candles will be the one that opens at 11pm est and closes at Midnight est and the candle that opens at 4am est and closes at 5am est. If you are useing the provided MT4 platform the Midnight candle will be 7:00 GMT
within the MT4. Count forward 6 candles including the 7:00 candle to find the 4-5am est candle.
Please check to make sure that the 7:00 GMT time is correct and that it is in fact the Midnight est candle as some MT4 servers run on different server times.
Here is a link to an online timezone converter that will help you find the correct time for the timezone you live in.
Step 3:
AFTER YOU PLOT YOUR 2 LINES TAKE THE DIFFERENCE BETWEEN THOSE TWO PRICES AND THEN DIVIDE THE DIFFERENCE BY 3.
EXAMPLE: price high= 1.4881
price low = 1.4828
difference = 53
53 divided by 3 = 17.6
Your profit target on the first trade is the difference of the high and low you plotted divided by 3.
From the above example that would be 17 pips. You can move the 2 horizontal purple
colored first trade profit target lineson the Dailysetup chart to these profit points so they are easy to see. Save the chart template each day after plotting your lines so the lines are there in the general price range when you open your charts the next day.
BELOW ARE THE INSTRUCTIONS TO EXECUTE YOUR 3 TRADES PER DAY.
I will not go into patience or emotions or posistion size and management here as I write about those things elswhere in the added text
within the system. I will just explain what your are looking for and what to do to execute each of the 3 trades.
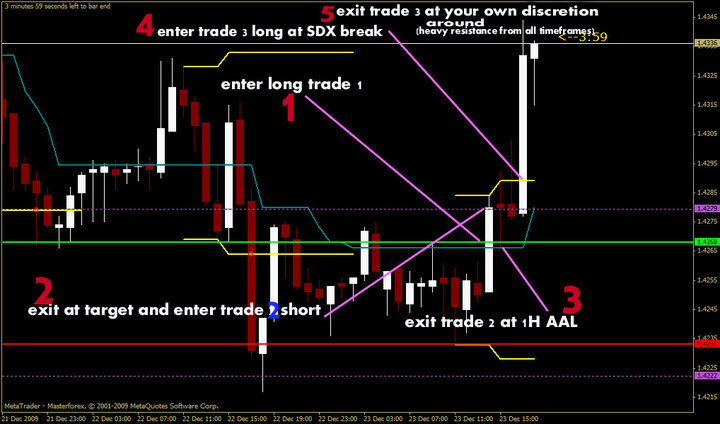
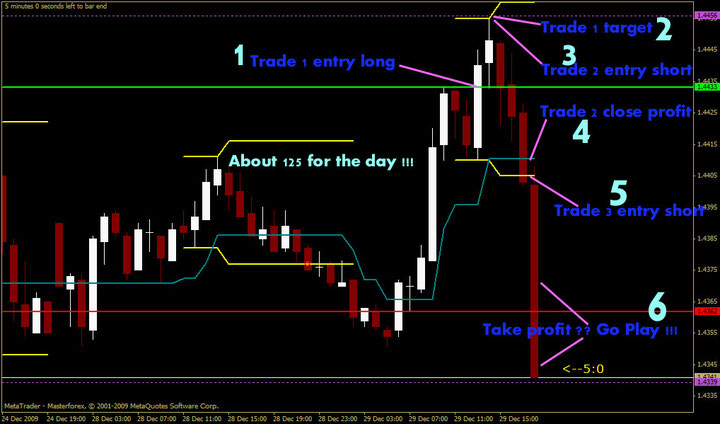
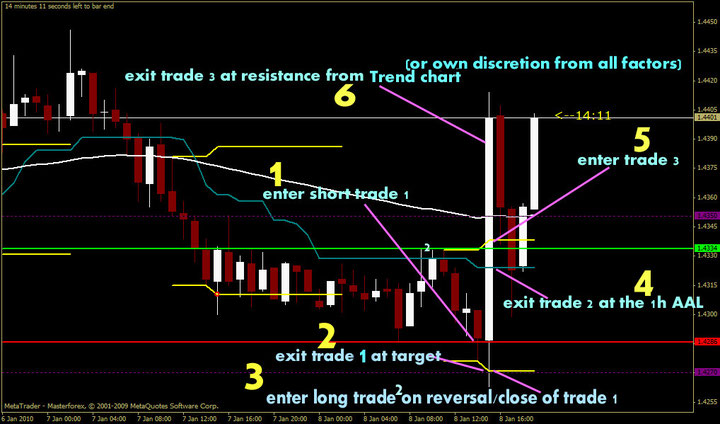
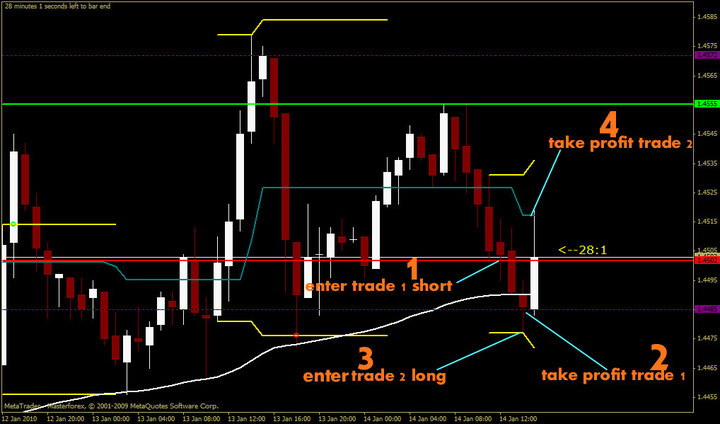
TRADE #1:
For trade 1....Look to enter as the price moves above (BUY) the GREENline that you plotted on the
"dailysetup" chart ORbelow the REDline (SELL).
Confirm your entry by looking at the indicators on the larger 5M "Enter Exit" chart.
That is to look for the top bar indicator (FX trend ) to turn red for a short break (lower red plotted line) or green for a long break (upper green plotted line) as the price is about to break one of your plotted lines on the Dailysetup chart and as the candle color (TTM TREND) on the Enter Exit chart is the same color. Then you will look for the MAXMA indicator (red or green "dots" on the enter Exit chart)to turn the same color of the FX trend indicator and the candle color from the TTM indicator. You will also be looking for the Line in the center of the "Enter Exit" chart (Audio Alert Line) to change color in acordance of the break.
The Confirmation of the plotted lines break should be from the above stated indicators conditions. (A non coresponding/delay or no change of the AAL indicator color could be a sign of a week trend or a false spike).
Either exit the trade at your calculated target as in the example above (and included example pictures) or when the YELLOW SDX lines appear on the dailysetup chart (reaching either a high or a low depending on the direction at the time) or a significant support or resistance according to your pivots on the Enter Exit chart. The session pivots (Orange lines on the MULTIFRAME charts and TREND chart) should be respected as likely places the price will change direction. Sounds tricky but after some practice and mainly watching the trades line up each day it is not as difficult as it sounds.
***
Please note that the yellow SDX breakout indicator is set at #3 in its TIMEZONE OF DATAproperties by default. You might have to change its setting # to have it appear properly for your peticular timezone. The rule will be to have the SDX appear about 4 hours after the London open. The SDX will appear plus or minus and hour from 7am est (or 4 hours after the London open). This is what it should do. Once you have it set to consistantly appear do not change the setting as it will calibrate itself each day to give a heads up for the entry of trade 2 depending on the previous several hours of price action.
TRADE #2:
After closing trade 1.... Reverse the trade position and look for the price to pull back to the 30M Audio Alert Line for a conservative trade or to the 1H or 4H AALfor an aggressive trade again useing the 5M "Enter Exit " chart for confirmation of the reversal.
TRADE #3:
If you have executed these 2 trades sucsessfully it may be best to quit for the day and enjoy your profits.
But if you still want more or did get stopped out, the 3rd trade will be to look for the breakout of the YELLOW SDX indicator.
Either a break low (Sell) or a break high (buy). This trade will be confirmed the same way you confirm trades 1 and 2 useing your "Enter Exit" chart. Typically if the Yellow SDX indicator that you are starting to see a break of developing is above the GREENhorizontal line you plotted, the price will breakout high. If the SDX indicator is below the REDHorizontal line you plotted the price will typically breakout low.
Look to exit after 20 pips or at support or resistance on the Enter Exit chart. These 3rd trade breakouts can run 100 pips some days so I'll leave the exits to you. The added BASIC chart is just to give a quick visual of the daily price action and is good to use on the 4Hour time frame also to see trend breakouts comming, after you get familiar with the 3 trade entries and exits and over all daily price action
Stop Loss rules
ON ANY OF THE 3 TRADES YOU ARE BEST TO CLOSE A LOOSING TRADE IF THE CANDLE OPENS (AGAINST YOUR DIRECTION) ABOVE OR BELOW ON THE5MTIME FRAME. This will be the red and green line on the "Enter Exit" chart in the main MT4.
You can enter again if the breakout tries again, but it is probably best to go outside for some fresh air since at this point you are either in
profit for the day or at a small loss. Tomorrow is another day and it is best to walk away up or with a small loss instead of risking having a not great
trading day turn into a real bad one. Remember also that the names for the 3 trades are just that.."Designations".
They are not nessasarily an order of the trades to be taken in. Trade 1 is trade 1 or the first trade, but if trade 1 fails to make its calculated target it is still valid and can be taken after trade 2 is complete. Some days trade 1 and trade 3 will complete together after trade 2 is complete. Also remeber that complete is only when any of the 3 trades makes its profit target. If the trade is not "complete" it is still valid if the parameters for entry as outline above are met.

Models Candelstik Patterns - Forex Strategies - Forex Resources ...
33# 3° Candle Scalping - Forex Strategies - Forex Resources ...
58# 3 Candles High or Low - Forex Strategies - Forex Resources ...
23# Big Eating Small Pattern Strategy - Forex Strategies - Forex ...
168# Price Action Scalping III - Forex Strategies - Forex Resources
366# Onaji San Candle - Forex Strategies - Forex Resources -
26# GPY 4H Strategy - Forex Strategies - Forex Resources - Forex
106# The Boomerang - Forex Strategies - Forex Resources -
21# 100 pips daily - Forex Strategies - Forex Resources - Forex ...
10# Bullish Engulfing" and "Bearish Engulfing pattern with RSI ...
4# Candelstick Reversal II - Forex Strategies - Forex Resources ...
Candelstick basic patterns - Forex Strategies - Forex Resources ...
16# Lucky Spike - Forex Strategies - Forex Resources - Forex ...
36# Hells Angels - Forex Strategies - Forex Resources -
Forex ...

Write a comment