


304# Dual WaveTrend, and S/R lines
MaximoTrader2026
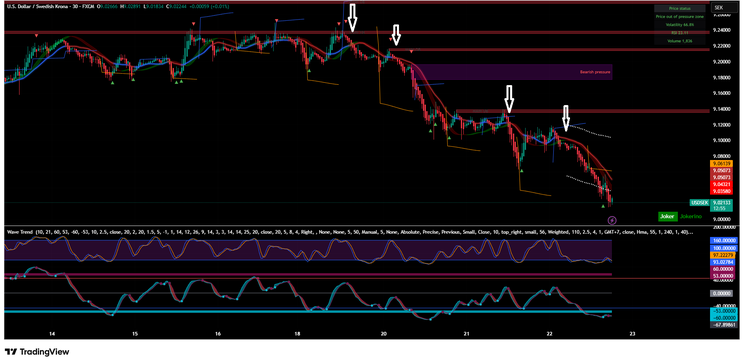
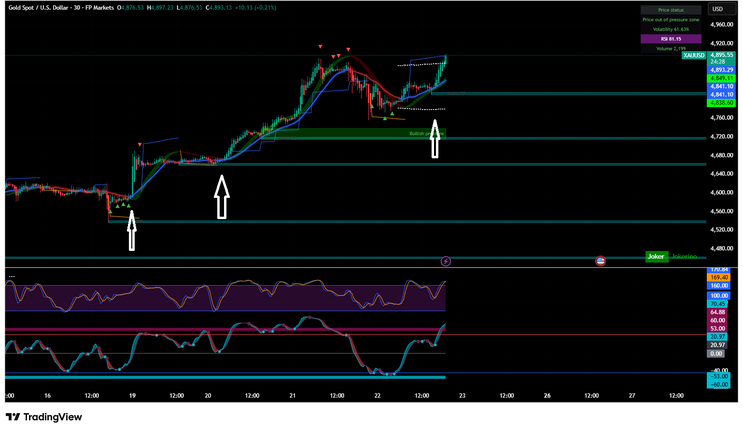
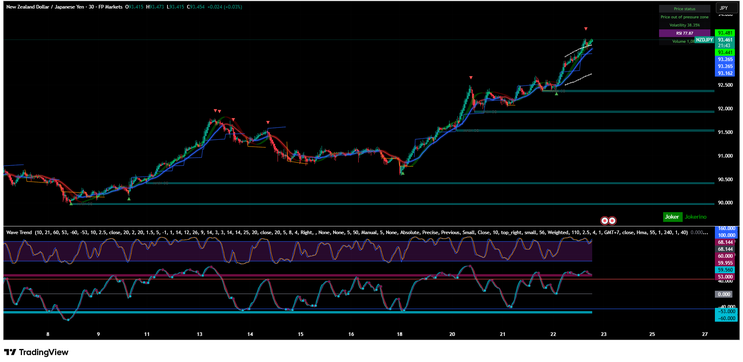
Dual WaveTrend, and S/R lines is built around a simple but powerful idea: combine structural pressure zones with momentum confirmation to capture clean reversals and continuation moves. In the USD/SEK 30‑minute example, the chart highlights:
-
A bearish pressure zone
A clear label showing “Price out of pressure zone”
Dynamic support/resistance levels
Two WaveTrend oscillators with identical settings
-
Volatility and volume metrics
Trend‑based annotations such as “Bearish pressure”
This creates a trading environment where structure, momentum, and volatility work together to filter noise and reveal high‑probability setups.
Setup
1. Pressure Zones
The chart visually marks areas of bearish pressure. These zones define the dominant directional bias and help identify when the market is compressed or trending.
2. Support & Resistance Zones
Automatic S/R levels are plotted directly on the chart. These zones act as:
-
Entry filters
Stop‑loss anchors
Take‑profit targets
3. Dual WaveTrend Oscillators
Two WaveTrend indicators with the same configuration are displayed in the lower panel. Using two identical oscillators may seem redundant, but it serves a purpose:
-
WT1 and WT2 must agree,
This reduces false signals,
Momentum shifts become clearer and more reliable.
4. Volatility & Volume
A small information box shows:
-
Volatility percentage,
Volume,
Trend status (“Price out of pressure zone”).
These metrics help confirm whether the market has enough energy to sustain a move.
Trading Rules
A. Long Setup (Buy)
A long trade is valid only when bearish pressure ends and momentum begins to shift upward.
Conditions
-
Price exits the bearish pressure zone
-
The chart must display “Price out of pressure zone.”
This signals that downward pressure is weakening.
-
-
Price interacts with a demand/support zone
-
Look for rejection, wicks, or stabilization at a support level.
-
-
Dual WaveTrend bullish alignment Both WaveTrend oscillators must show a consistent bullish signal:
-
WT1 and WT2
Both curves turn upward from a low region This dual confirmation filters out weak reversals.
-
-
Volatility not extremely compressed
-
The volatility value should not be at minimal levels.
A reversal needs energy.
-
Entry
-
Enter long on the first bullish candle that closes outside the bearish pressure zone.
Stop‑Loss
-
Below the nearest support zone or the most recent swing low.
Take‑Profit
-
TP1: First resistance level.
TP2: Opposite side of the previous pressure zone.
TP3: Major structural level (optional).
B. Short Setup (Sell)
A short trade is valid when bullish pressure breaks and momentum shifts downward.
Conditions
-
Price exits the bullish pressure zone
-
The label “Price out of pressure zone” must appear on the upside.
-
-
Price rejects a supply/resistance zone
-
Look for bearish candles or upper wicks.
-
-
Dual WaveTrend bearish alignment Both WaveTrend oscillators must show:
-
WT1 WT2
Both curves turning downward from a high region
-
-
Volatility supportive
-
Avoid entries during flat, low‑energy phases.
-
Entry
-
Enter short on the first bearish candle that closes outside the bullish pressure zone.
Stop‑Loss
-
Above the nearest resistance zone or the most recent swing high.
Take‑Profit
-
TP1: First support level.
TP2: Opposite side of the previous pressure zone.
TP3: Major structural level (optional).
Conclusion
The Melona OB Strategy offers a structured and disciplined way to trade by combining:
-
Pressure zones to define trend bias
Automatic support/resistance for precision
Dual WaveTrend oscillators for momentum confirmation
Volatility and volume to validate market conditions
The example chart demonstrates how a bearish pressure zone breaks, price exits the zone, and the dual WaveTrend begins to shift upward — a textbook environment for a potential long setup.
This approach helps traders avoid emotional decisions and focus on setups where structure, momentum, and volatility align with clarity.
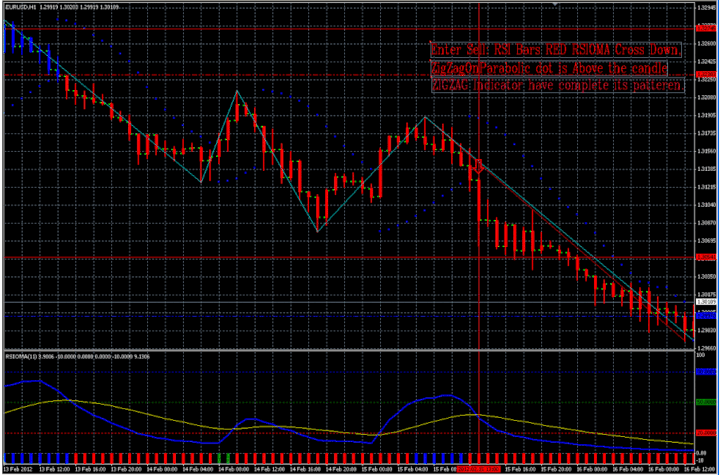
304# ZIG ZAG Parabolic and Rsioma Strategy
Parabolic on Zig Zag indicator
Submit by joy22 16/02/2012
Time frame H1
Currency pairs:all
Indicators:
RSIOMA v.2 (11),
Parabolioc on ZIG ZAG,
Support and Resistance 4H,
Zig ZAG,
RSI BARS.
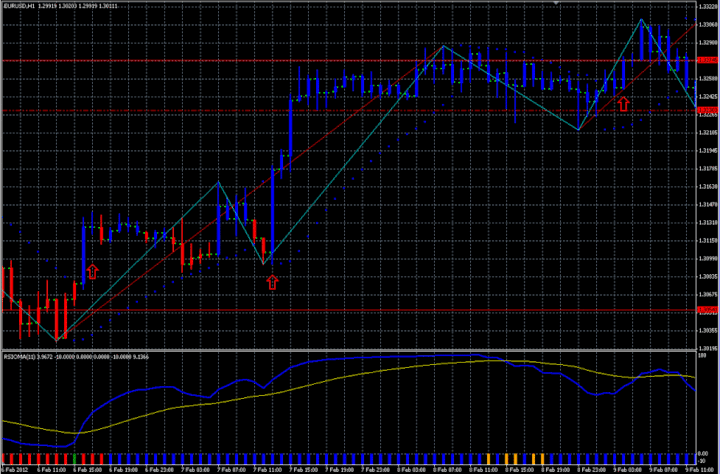
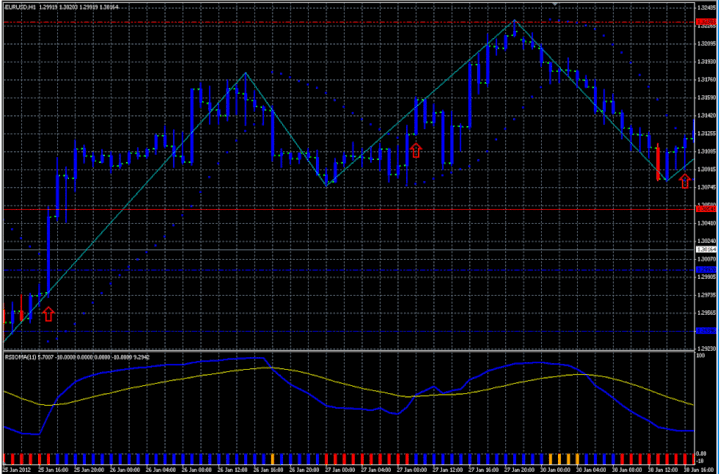
Long Entry:
1. RSIoma cross up .
2 . ZIGZAG Indicator have complete its patteren.
3. ZigZagOnParabolic dot is below the candle.
4 RSI Bars is Blu
Short Entry:
1. RSIoma cross down .
2 . ZIGZAG Indicator have complete its patteren.
3. ZigZagOnParabolic dot is above the candle.
4 RSI Bars is Blu
Exits position:
We use support and resistance indicators for Profit Target.
Sto loss last swing High or Low.
In the pictures ZIG ZAG Parabolic and Rsioma Strategy forex system in action.
Zig Zag parabolioc and RSIOMA Trading system: Indicators and Templete


-
#2
h
-
#1
Thank you very much but where is the Template ?
best regards
MARTIN
Parabolic Sar Forex Strategies
24# Parabolic Sar Trend Scalper - Forex Strategies - Forex ...
13# Parabolic SAR and Fibonacci - Forex Strategies - Forex ...
69# ADX, Parabolic Sar and three EMA - Forex Strategies - Forex
16# Moving Average Channel and Parabolic Sar - Forex Strategies
69# ADX, Parabolic Sar and three EMA - Forex Strategies - Forex
35# Parabolic, Stochastic and MACD - Forex Strategies - Forex ...
9# Parabolic Sar and ADX - Forex Strategies - Forex Resources ...
12# Parabolic and Awesome - Forex Strategies - Forex Resources
1# Parabolic and Volumes - Forex Strategies - Forex Resources ...
392# Parabolic Sar Explosion - Forex Strategies - Forex
216# Forex Miko Parabolic System - Forex Strategies - Forex ...
91# Parabolic Sar with EMA - Forex Strategies - Forex Resources
1# 3 Parabolic SAR - Forex Strategies - Forex Resources - Forex
304# ZIG ZAG Parabolic and Rsioma Strategy - Forex Strategies ...
33# PSAR, MACD, CCI, Moving Averages - Forex Strategies -
