


358# GMMA 4-Candle Confirmation Strategy for MT4
Janus Trader 2026
GMMA 4-Candle Confirmation Strategy strategy is a simple trend-following method based on the alignment of the Guppy Multiple Moving Average (GMMA) Slow indicator and directional arrow signals. It is designed to capture medium- to high-probability entries when price confirms a change in momentum and begins moving in the direction of the dominant trend.
The strategy works best on volatile currency pairs such as GBPJPY, GBPUSD, EURJPY, AUDUSD, and XAUUSD. The recommended time frame is 5 minutes or higher. Higher time frames generally provide stronger and more reliable signals.
Platform: MT4
Indicators:
GMMA Slow
Arrow indicator
Platform: MT4
Indicators:
GMMA Slow
Arrow indicator
Setup
The GMMA Slow consists of a group of moving averages that reflects the underlying market trend.
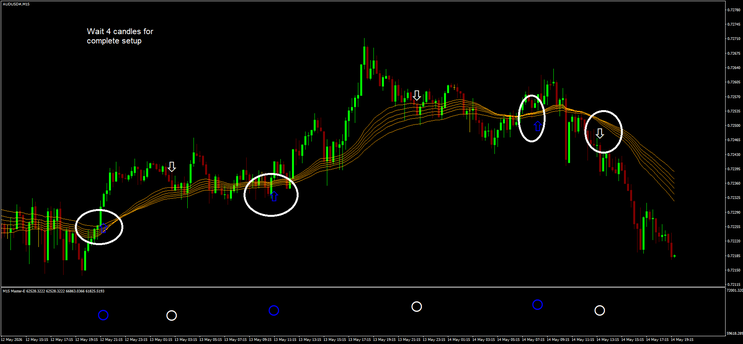
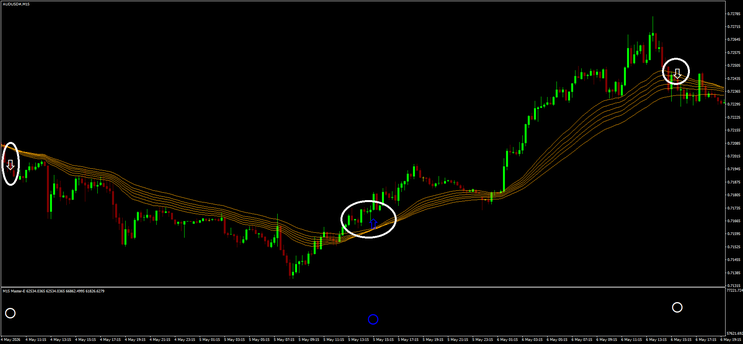
When the GMMA lines are compressed and begin to fan out upward, this indicates that bullish momentum is increasing.
When the GMMA lines are compressed and begin to fan out downward, this indicates that bearish momentum is increasing.
The Arrow indicator provides the entry signal:
A blue arrow indicates a potential buy opportunity.
A white arrow indicates a potential sell opportunity.
After an arrow appears, wait for 4 completed candles before entering the trade. This waiting period allows the indicators to align and helps filter out false signals.
Trading Rules
Buy Rules
A blue arrow appears below price.
Price closes above the GMMA Slow.
The GMMA Slow lines are turning upward and beginning to separate.
After the blue arrow appears, wait for 4 completed candles.
Enter a buy trade at the opening of the fifth candle if price remains above the GMMA and the upward alignment is still valid.
Place the stop loss below the most recent swing low.
Set the take profit at a minimum risk-to-reward ratio of 1:2, or trail the stop as long as price remains above the GMMA.
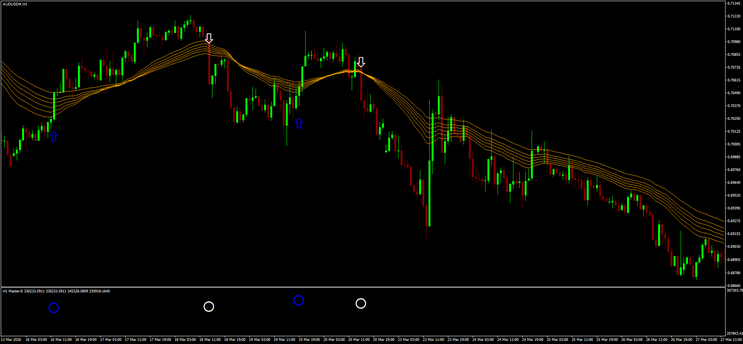
Sell Rules
A white arrow appears above price.
Price closes below the GMMA Slow.
The GMMA Slow lines are turning downward and beginning to separate.
After the white arrow appears, wait for 4 completed candles.
Enter a sell trade at the opening of the fifth candle if price remains below the GMMA and the downward alignment is still valid.
Place the stop loss above the most recent swing high.
Set the take profit at a minimum risk-to-reward ratio of 1:2, or trail the stop as long as price remains below the GMMA.
Additional Notes
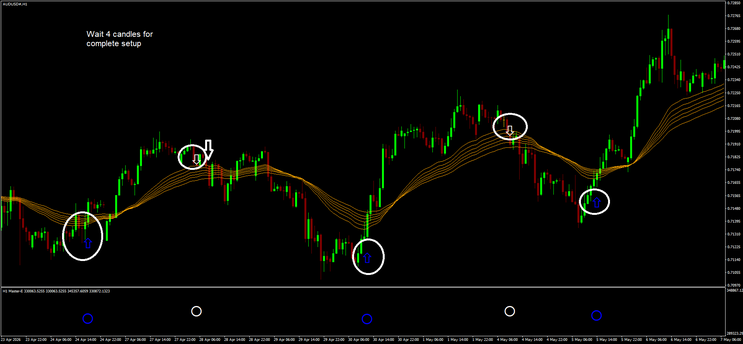
Avoid taking trades when the GMMA lines are flat and tightly compressed, as this usually indicates a ranging market.
The best setups occur when the arrow appears immediately after price breaks through the GMMA and the moving averages begin to expand in the new direction.
If, during the 4-candle waiting period, price crosses back through the GMMA or the moving averages lose alignment, cancel the setup.

Conclusion
The GMMA Trend Alignment Strategy is a disciplined and visually intuitive method for trading momentum in volatile markets. By combining arrow signals with the structure of the GMMA Slow and enforcing a 4-candle confirmation period, the strategy helps traders focus on higher-probability entries while avoiding premature trades.
Patience is the key element of this approach. Waiting for the full setup to mature significantly improves signal quality and aligns entries with the strongest part of the trend.
15 menit
Submit by Ketang 28/06/2012
klik 15menit-1 untuk pair GBP/USD, EUR/USD, USD/CHF, USD/CAD, AUD/USD, EUR/GBP,
EUR/CHF, GBP/CHF, NZD/USD atau pair yang memiliki 4 angka desimal dibelakang koma
Klik 15menit-2 untuk pair GBP/JPY, EUR/JPY, USD/JPY, CHF/JPY. atau pair yang memiliki 2 angka desimal dibelakang koma. Maka muncul gambar seperti dibawah ini untuk template 15menit-1 : Maka muncul gambar seperti dibawah ini untuk template 15menit-2 :
Gambar diatas merupakan pergerakan pada PAIR GBP/USD dan PAIR EUR/JPY pada Time Frame 15 menit, dengan dilengkapi text, dot, trend dan line indikator untuk penggunaan trading sistem 123 anda bisa baca dibawah ini sedangkan untuk sistem open, anda tinggal menunggu kapan harga menyentuh open buy atau open sell.
Text Indikator
Dengan fasilitas ini anda bisa mengetahui price untuk open buy atau open sell serta target profit yang bisa anda set di FOREX, tidak hanya itu saja jika dulu anda setiap hari menghitung batas Resistance dan Supportpada pair manapun, sekarang dengan fasilitas ini batas Resistance dan Support hingga level 3 secara otomatis akan menghitung sendiri setiap harinya.
Dengan fasilitas ini memudahkan anda untuk mengetahui batas -batas price untuk open position serta target profit 20 pips, 30 pips, 40 pips dan 60 pips, open buy serta target profit diwakili line biru, open sell serta target profit diwakili line merah. Setiap hari secara otomatis line terbentuk pada semua pair
Trend Indikator
Merupakan salah satu syarat dalam menggunakan Trading Sistem 123 bahwa warna biru menyatakan trend UP dan warna merah menyatakan trend DOWN. Dengan fasilitas ini anda bisa mengetahui kapan harga bergerak ke trend UP atau trend DOWN.
Dot Indikator
Merupakan salah satu syarat dalam menggunakan Trading sistem 123 bahwa jika DOT biru muncul di bawah candlestick biru yang akan di cocokkan dengan trend indikator biru merupakan tanda open BUY dan jika DOT merah muncul di atas candlestick merah yang akan dicocokkan dengan trend indikator merah merupakan tanda open SELL.
In the pictures 15 Menit forex system in action.
Gambar diatas merupakan pergerakan pada PAIR EUR/USD pada Time Frame 15 menit, terlihat pada gambar tersebut sudah saya tandai dengan angka 1 2 3 yang berarti hanya memerlukan ketiga tanda tersebut dan simsalambim saatnya open posisi anda. Prinsipnya hanya menunggu titik besar bagi biru untuk BUYmaupun merah untuk SELL, kemudian melihat trend dari garis gelombang apakah warna biru untuk BUYatau merah untuk SELL, untuk lebih menyakinkannya dilihat lagi pada trend indicator warna biru untukBUY atau warna merah untuk SELL. Setelah ketiga tanda tersebut sudah sejajar maka itu saatnya untuk open posisi, akan tetapi berhati – hati terhadap news yang ada pada hari itu, karena untuk sesaat akan berbalik posisi dengan posisi sebelumnya atau meneruskan posisi sebelumnya.
Share your opinion, can help everyone to understand the forex strategy.
-
#1
hai,file sudah saya download,namun tidak ada files petunjuk.pdf
mohon bantuannnya,thanks
98# Bouncing EMA and KG Analysis - Forex Strategies - Forex ...
169# Winning Solution - Forex Strategies - Forex Resources - Forex ...
38# Bunny Girl System - Forex Strategies - Forex Resources - Forex ...
347# Arno Forex trend following Method
122# 15 min MTF - Forex Strategies - Forex Resources - Forex ...
104# Vlad System 15 min Day Trading - Forex Strategies - Forex ...
301# Easy 15min Trading System - Forex Strategies - Forex ...
13# The Trend Setter, Channel Drawing Filter (15min) - Forex ...
75# Profit System - Forex Strategies - Forex Resources - Forex ...
