348# Forex Creative Universal
Dimitri 2026
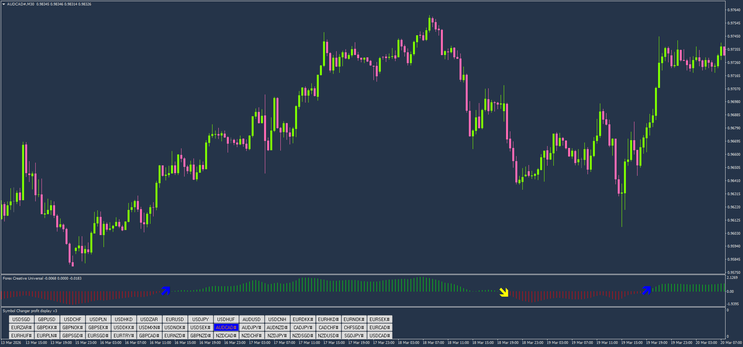
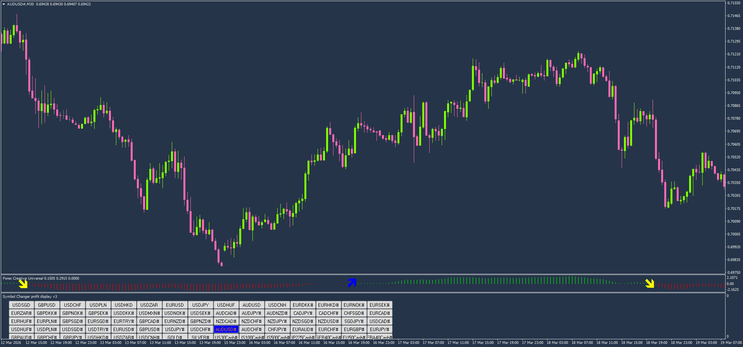
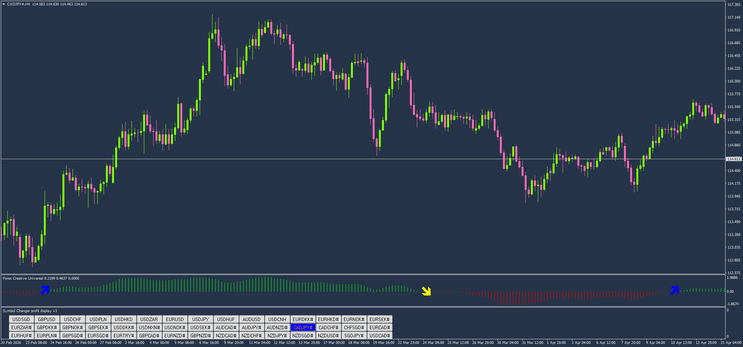
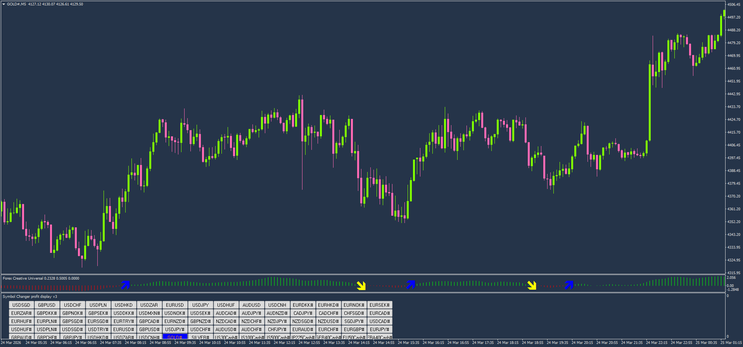
The Forex Creative Universal is a momentum and trend-following oscillator designed for MetaTrader 4. Visually, it resembles a histogram that fluctuates around a zero line. Green bars indicate bullish momentum, while red bars indicate bearish momentum. A blue up arrow signals a potential buy entry, and a yellow down arrow signals a potential sell entry. The indicator is versatile and works across various timeframes and asset classes.
Setup
The platform required is MT4 with the Forex Creative Universal indicator attached to the chart. The recommended timeframes are M15, M30, or H1 for day trading, and H4 for swing trading. It works well on major pairs, crosses, and commodities like gold.
Trading Rules
For a long strategy, you must wait for the blue up arrow to appear below the indicator window. The histogram bars should turn green and start expanding upwards to confirm increasing bullish momentum. You enter a buy order at the close of the candle where the blue arrow appears.
The stop loss is placed below the most recent swing low.
For take profit, you can exit when the yellow down arrow appears, or target a specific risk-to-reward ratio.
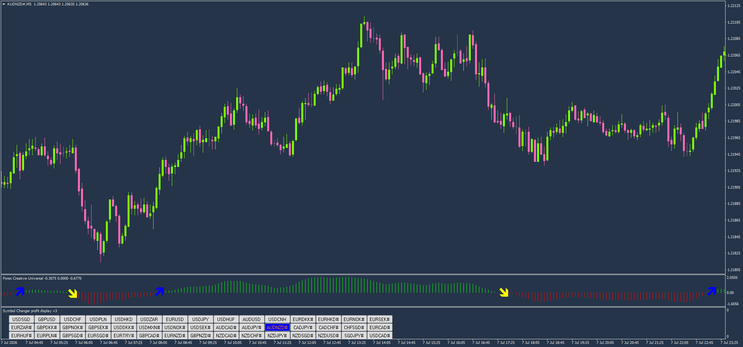
For a short strategy, you wait for the yellow down arrow to appear. The histogram bars should turn red and expand downwards to confirm bearish momentum. You enter a sell order at the close of the candle where the yellow arrow appears.
The stop loss is placed above the most recent swing high.
You exit the trade when the blue up arrow appears, or at your target ratio. To manage the trade and filter out bad signals, only take buy signals if the higher timeframe trend is up, and sell signals if the trend is down. Avoid trading when the histogram bars are very small and flat near the zero line, as the market is ranging.
Conclusions The Forex Creative Universal is a robust trend-following tool that successfully captures large moves by keeping the trader in the trend as long as the histogram bars remain one color. Its main strength is providing clear visual entry and exit signals, but its weakness is that it may give late signals in very fast markets or produce false signals in sideways, ranging markets. It is highly recommended to combine this indicator with price action or a moving average to filter out bad signals and improve overall accuracy.

348# FX Stage Trading System
Submit by Janus Trader (Written by http://www.stage3forex.com/ ) 09/06/2012
Time Frame 15 min or higher .
Currecy pairs:any;
Indicators:
Trend Indicator:
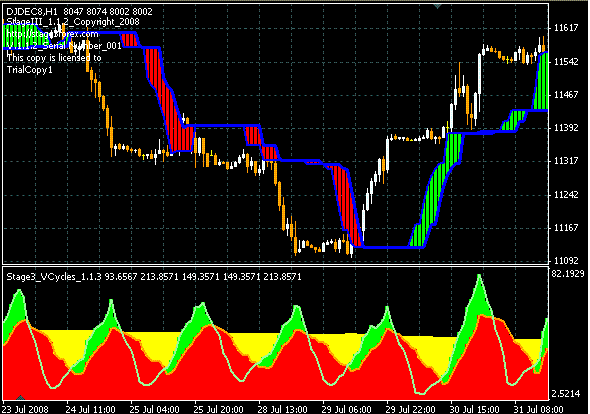
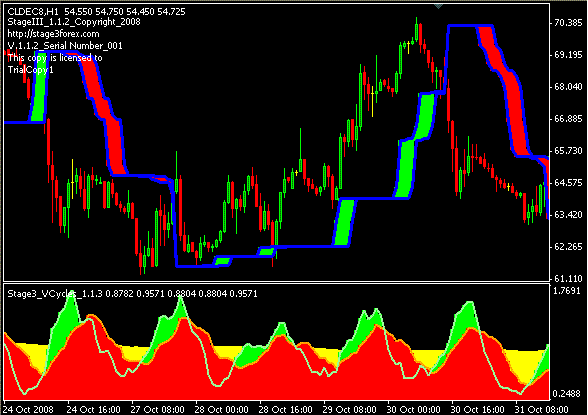
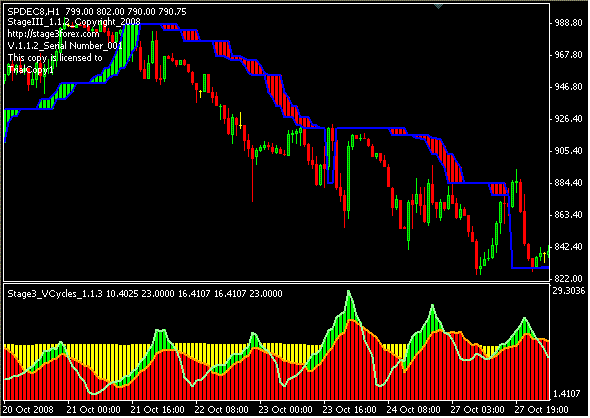
The Trend Indicator is used to understand market direction. A close above the indicator signifies a Long Biaswhile a close below signifies a Short Bias.
Volatility Cicles:
The VCycles Indicator is a proprietary index measuring the patterns and magnitude of an instruments volatility. It is used to filter trades by eliminating areas where the propensity for a move is low while highlighting areas with a high or increasing propensity for a move.
Entry Rules: A BUYor SELLsignal is defined as either:.1. A close above / below the Trend Indicator WHILE short term volatility is increasing (VCycles displays Green).
EXAMPLE: An hourly close breaches the Trend Indicator in a downward direction, while at the same time the VCycles Indicator displays increasing short term volatility (Green). Yielding a SELLSignalOR2. Short term volatility increasing WHILE the current price is above / below the Trend Indicator EXAMPLE: The current price is already above the Trend Indicator AND VCycles begins to show a measurable increase to short term volatility (the indicator begins to display Green).
BUYSignalDetailed
In the below example, a BUYSignal is generated based on the first entry rule; A close above / belowthe Trend Indicator WHILE short term volatility is increasing.
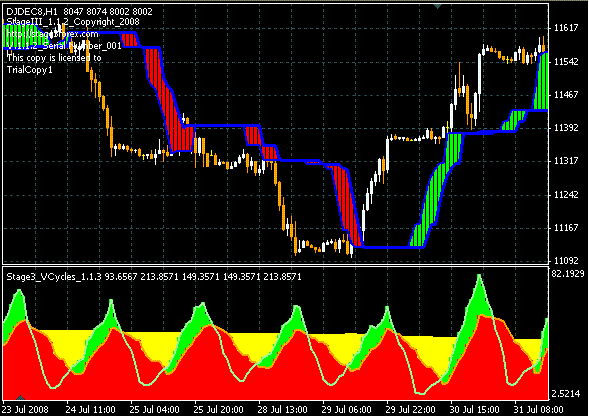
Training In the next example (below) multiple short signals are generated based on the second entry rule;Short term volatility increasing WHILE the current price is above / below the Trend Indicator
Stop
Stop Loss & Targets In this section we will explain the methodology behind selecting stop loss and take profit levels. A static stop loss and take profit should always be placed at the time at which a trade is opened. Under contain circumstances it is appropriate to trail the stop to protect the position, these situations are explained in detail in the following section entitled “When to Trail the Stop”.
Stop Loss Placement Example: In the example to the right, a Buy order is opened at “1” and the initial stop is placed below the Trend Indicator at “2”Another Example follows. In general, a trader should seek to place the initial Stop Loss to the outside of the Trend Indicator. For example a Sellorder should have a stop placed abovethe Trend indicator, while a Buyorder should have a stop placed belowthe Trend Indicator.
Placement Example: In the example to the right, a Buy order is opened at “1” and the initial stop is placed below the Trend Indicator at “2”.