


308# Trade Forge Trading System – Strategy Guide
Dimitri 2026
The Trade Forge Trading System is a discretionary trading framework designed for MetaTrader 4.
It combines dynamic support and resistance zones, trend guidance, and visual entry triggers.
Rather than executing trades automatically, the system helps traders answer three essential questions:
-
Where is the market likely to react?
-
What is the current directional bias?
-
When is the right moment to pull the trigger?
The confluence of the TradeForge indicators creates a structured environment where entries, stops, and targets become clearer and less emotional.
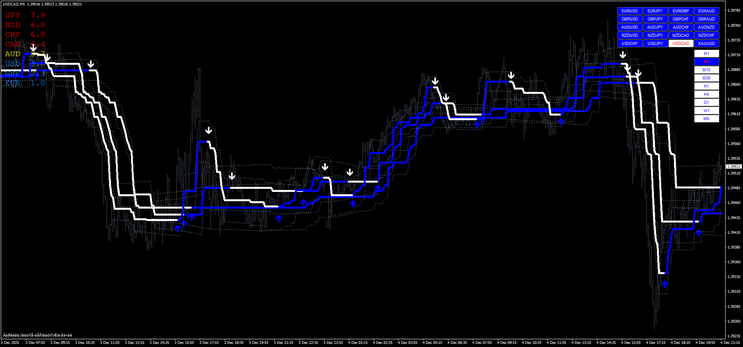
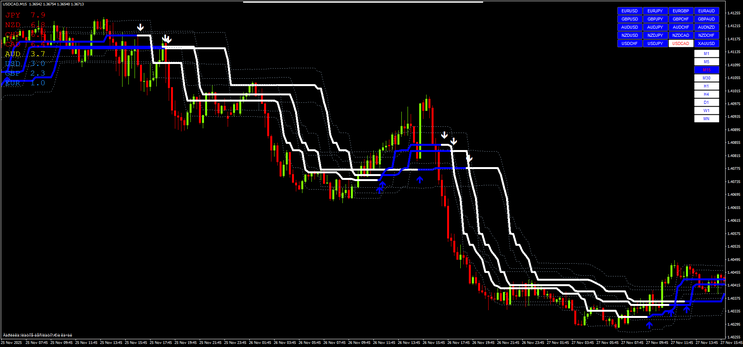
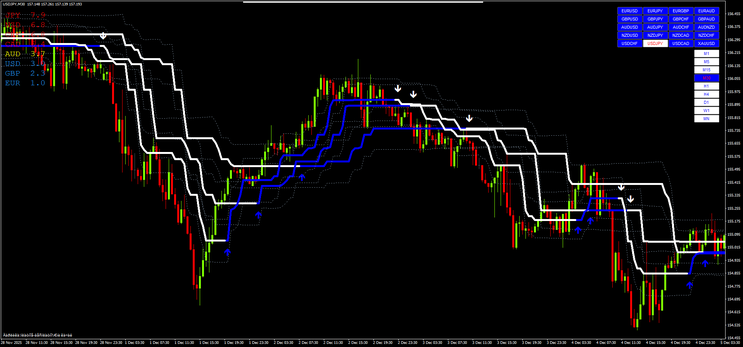
Setup
Based on the chart, the template includes the following tools.

TradeForgeCS
Draws the main step-like bands (white/gray).
These act as dynamic resistance in downtrends and support in uptrends.
TradeForge Entry (1–3)
These generate the blue levels and arrows that mark potential reaction and continuation areas.
Trading Assistant
Provides additional market context and quick symbol/timeframe navigation.
Timer-Best
Used for session or timing awareness.
Buy Rules (Long Trades)
Step 1 – Direction
Prefer buys when:
-
price is above the main bands, or
-
the market is bouncing from a lower blue support.
Step 2 – Location
Wait for price to touch or slightly penetrate a support zone.
Step 3 – Trigger
A blue upward arrow appears from TradeForge Entry.
Entry
Buy at the candle close or at the open of the next candle.
Stop Loss
Place it:
-
below the recent swing low
orbelow the lower band.
Take Profit
Target:
-
the next upper white/gray band
or use a risk:reward of 1:1.5 to 1:2.
What a good BUY looks like
Trend up → pullback → blue zone → arrow → continuation.
Sell Rules (Short Trades)
Step 1 – Direction
Prefer sells when:
-
price is below the main bands, or
the market rallies into resistance.
Step 2 – Location
Price reaches a resistance band.
Step 3 – Trigger
A down arrow appears.
Entry
Sell at candle close or next candle open.
Stop Loss
Place it:
-
above the swing high,
orabove the resistance band.
Take Profit
Aim for:
-
the next lower band,
or RR 1:1.5 / 1:2.
Conclusions
The Trade Forge Precision System is powerful because it provides:
structured market zones,
visual timing,
logical stop and target placement,
multi-layer confirmation.
But it is still a decision-support tool.
Profitability depends on discipline, patience, and selecting high-quality setups rather than trading every arrow.
Used correctly, the system helps traders think in terms of location + confirmation + continuation, which is the foundation of professional trading.
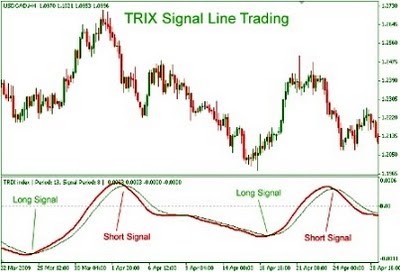
309# Trix Strategy Trading System
Introduction
The TRIX Indicator was developed in the early 1980s by Jack Hutson who was an editor for the Technical Analysis of Stocks and Commodities magazine. Its name is comprised of its calculation: Triple Exponential. The TRIX is calculated using triple smoothing of price and therefore it is generally trend-following and a bit lagging in signals.
Calculation
1. Smooth price with 14-period Exponential Moving Average (EMA).
2. Smooth the EMA from step 1 with 14-period Exponential Moving Average (EMA).
3. Smooth the EMA from step 2 with 14-period Exponential Moving Average (EMA).
4. Divide the value (triple smoothed) of today from the one of yesterday. The result is the TRIX.
A signal line (Slowed version of the TRIX) is then calculated, to be used in generating signals.
Trading with the TRIX
The TRIX is traded in several ways, generally like the MACD which is visually similar.
Trading Method #1: Signal Line Cross
This method uses the signal line to generate buy and sell signals.
The trading rule is similar to the one used at MACD, Stochastic and more traditional indicators:
Trading Rules:
Buy when TRIX crosses its Signal Line from below.
Sell when TRIX crosses its Signal Line from above.
Trix Indicator Metatrader MT4
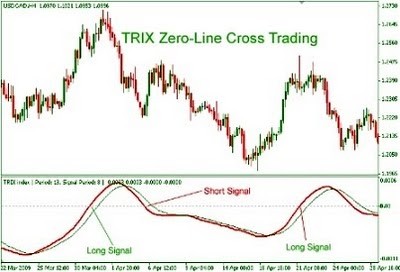
Trading Method #2: Zero-Line Cross
Since the TRIX revolves around its zero-line, it can be used as a pivot to gauge trend direction. This approach is similar to CCI and RSI trading signals.
Trading Rules:
Buy when TRIX crosses zero-line from below
Sell when TRIX crosses zero-line from above
In the pictures Trix Strategy forex system in action.
Trading Method #3: Divergence
This trading method is used when the TRIX's visual behavior differs from the ones of price. Example: When TRIX is making lower highs and price making higher highs. This can be a signal of irregular trend that is weaker and prone to reversal. Opposite also valid: When TRIX is making higher lows and price is making lower lows. This can be a sign of a bullish reversal
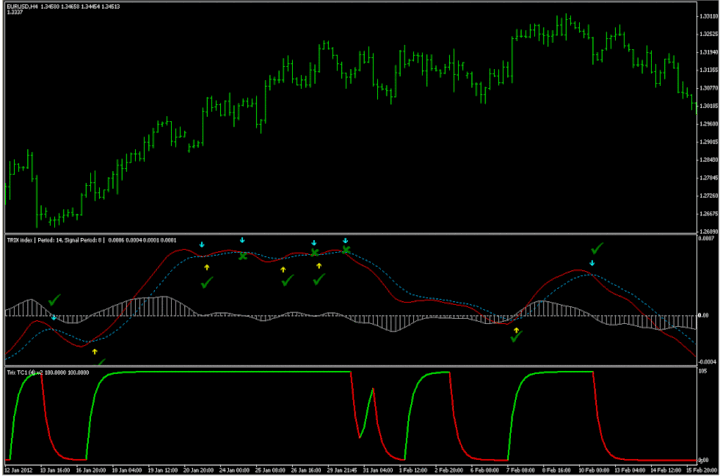
Trading Method #4: Trix Filtered by Trix Cycle
The Buy arrow is confirmed by green Trix Cycle.
Sell Arrow is confirmed by Red Trix Cycle.
Share your opinion, can help everyone to understand the forex strategy.
