345# TMA-LWMA Trend Following Strategy
Joy22 2026
The TMA-LWMA is a trend-following indicator designed to identify the prevailing market direction and provide visual entry signals through colored arrows. By combining a smoothed Triangular Moving Average structure with a Linear Weighted Moving Average, the indicator helps traders filter market noise while maintaining sensitivity to trend changes.
The strategy is based on a simple principle: trade in the direction of the dominant trend and use the arrow signals to time entries. Depending on the trader's style and experience, positions can be opened immediately at the first signal or after a pullback toward the moving average.
The indicator can be successfully applied to traditional candlestick charts, Range Charts, and Renko Charts.

Setup
The moving average period should be adapted to the selected timeframe:
5 Minute Chart → Period 50
15 Minute Chart → Period 34
•30 Minute Chart → Period 20
•60 Minute Chart → Period 20
Indicator Interpretation:
Green TMA-LWMA line = Bullish trend
Red TMA-LWMA line = Bearish trend
•Green arrows = Potential long opportunities
Orange arrows = Potential short opportunities
The slope of the TMA-LWMA is one of the most important elements of the strategy. Trades should preferably be taken only when the direction of the arrows aligns with the direction of the moving average.
Trading Rules
Long Trades
The TMA-LWMA line must be green and sloping upward.
A long position can be opened when the first green arrow appears after a correction or pullback within an existing uptrend.
Aggressive traders may enter immediately at the first green arrow. More conservative traders may wait for a retracement toward the TMA-LWMA before entering the market.
The highest-probability setups often occur when price pulls back toward the moving average and then resumes the trend, generating the first green arrow. These situations frequently mark the end of the correction and the beginning of a new impulsive move.
Additional positions may be added during strong trends when new green arrows appear and market structure remains bullish. This approach should only be considered by traders with sufficient experience in position management.
A trade can be closed when an opposite signal appears, when the moving average loses its upward slope, or according to the trader's predefined risk management rules.
Short Trades
The TMA-LWMA line must be red and sloping downward.
A short position can be opened when the first orange arrow appears after a corrective rally within an existing downtrend.
Aggressive traders may enter immediately at the first orange arrow. Conservative traders may wait for a retracement toward the moving average before opening a position.
The strongest short setups typically occur when price retraces toward the TMA-LWMA and then resumes the downward trend, producing the first orange arrow. These signals often indicate the completion of the correction and the start of a new bearish impulse.
Additional positions may be added during trend continuation when new orange arrows appear and the overall bearish structure remains intact. As with all scaling techniques, this approach requires solid risk management and trading experience.
A trade can be closed when an opposite signal appears, when the moving average begins to flatten or turn upward, or according to the trader's individual exit plan.

Position Management
The first arrow generated after a correction generally offers the best risk-to-reward opportunity because it appears near the beginning of a potential trend expansion.
Many traders prefer waiting for a pullback before entering because it allows for tighter stop placement and improved risk management.
The indicator frequently generates additional arrows during established trends. These signals can be used either as new entry opportunities or as confirmation for existing positions.
Position scaling and multiple entries can significantly improve overall profitability during strong trends; however, they should only be used by traders who understand exposure management and capital preservation principles.
Market Structure Analysis
When the TMA-LWMA changes color and slope, a potential trend reversal may be developing.
Clusters of arrows appearing in the same direction often indicate trend continuation and increasing momentum.
Pullbacks toward the moving average are an important component of this strategy because they frequently provide the highest-quality trading opportunities.
Although the indicator performs particularly well in trending markets, it can also be effectively applied to Range Charts and Renko Charts, where market noise is naturally reduced and trend structures become easier to identify.
Conclusion
The TMA-LWMA Strategy provides a straightforward and effective framework for trend trading. By combining trend identification through the moving average with visual arrow-based entry signals, traders can easily recognize potential opportunities while maintaining alignment with the prevailing market direction.
The strategy can be adapted to different trading styles, ranging from aggressive first-arrow entries to more conservative pullback entries. It is equally suitable for standard candlestick charts, Range Charts, and Renko Charts.
Like any trading methodology, consistent success depends on disciplined risk management, patience, and the ability to trade only when trend direction, market structure, and indicator signals are aligned. The highest-probability trades typically occur when the first arrow appears after a pullback toward the TMA-LWMA, signaling the possible beginning of a new trend impulse.


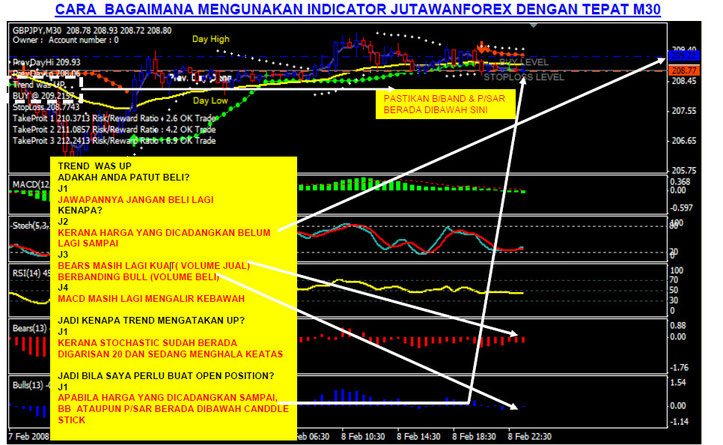
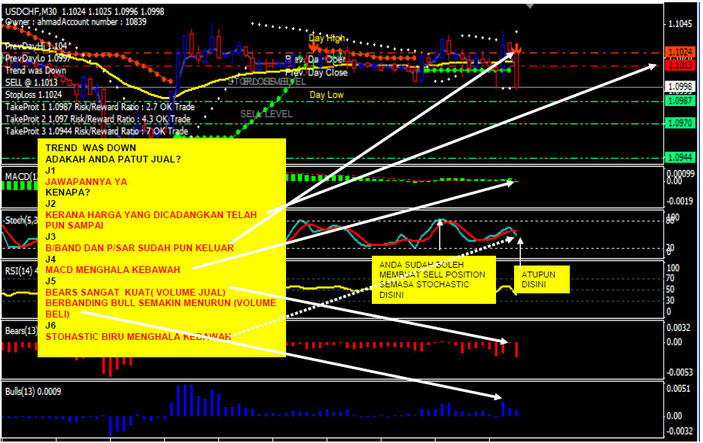
345# Jutawan Forex Strategy
Submit by Ketang 28/05/2012 (written by jutawan)
PARABOLIC SAR 1
Berfungsi sebagai penanda sama ada market sedang uptrend ataupun downtrend
Cara baca :- apabila PSAR berada diatas canddle stick bermaksud downtrend
:- apabila PSAR berada dibawah canddle stick bermaksud uptrend
BOLINGER BAND 2
Berfungsi sebagai penanda sama ada market sedang uptrend ataupun downtrend
Cara baca :- apabila BB (MERAH)berada diatas canddle stick bermaksud downtrend
:- apabila BB (HIJAU) berada dibawah canddle stick bermaksud uptrend
STOP LOSS 3
Memberitahu harga STOP LOSS yang dicadangkan untuk mengurangkan kerugian jika market berubah arah
TAKE PROFIT 4
Memberitahu TAKE PROFIT yang patut diambil berdasarkan pegerakan pasaran pada masa itu
MACD 5
Berfungsi sebagai penanda sama ada market sedang uptrend ataupun downtrend
Cara baca :- apabila graph semakin menaik ini bermakna harga semakin meningkat dan
penanda uptrend
:- apabila graph semakin kebawah ini bermakna harga semakin menurun dan
penanda downtrend
STOCHASTIC 6
Berfungsi sebagai penanda sama ada market sedang uptrend ataupun downtrend
Cara baca :- apabila STOCHASTIC bewarna MERAH mencecah penanda aras 80 harga akan menurun dan bermulanya downtrend
(anda dinasihatkan agar tidak membuat BUY POSITION pada masa ini)
:- apabila STOCHASTIC bewarna BIRU mencecah penanda aras 20 harga akan
meningkat dan bermulanya uptrend
(anda dinasihatkan agar tidak membuat SELL POSITION pada masa ini
RSI 7
Berfungsi sebagai penanda sama ada market sedang uptrend ataupun downtrend
Cara baca :- apabila RSI berada di atas 70 ini menandakan pasaran terlebih belian dan boleh mengakibatkan harga jatuh pada bila-bila masa
(anda dinasihatkan agar tidak membuat BUY POSITION pada masa ini)
:- apabila RSI berada di bawah 30 ini menandakan pasaran terlebih jualan dan
boleh mengakibatkan harga naik pada bila-bila masa
(anda dinasihatkan agar tidak membuat SELL POSITION pada masa ini)
BEARS (RED) 8 & BULL (BLUE) 9
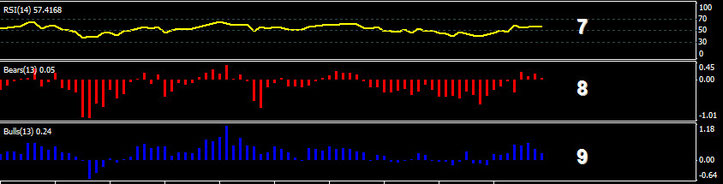
Berfungsi sebagai penanda sama ada market sedang uptrend ataupun downtrend
Cara baca :- apabila BEARS dan BULL berada diatas ini bermaksud buy dan sell
berlaku pada masa yang sama dan apabila BEARS berada di atas dan
BULL dibawah ini bermaksud SELL berlaku dahulu diikuti dengan BUY
( apabila BULL lebih tinggi dari BEARS ini bermaksud uptrend)
( apabila BEARS lebh tinggi dari BULL ini bermaksud downtrend)
RINGKASAN INDICATOR JUTAWAN FOREX
Diharap dengan penerangan satu persatu dari signal 1-9 telah membuat kan anda
Bertambah jelas dengan apa yang diterangkan
Kebiasaannya para trader hanya memeriksa 1,2 5,6,7,8 & 9
No 3 & 4 tidak dapat ditentukan dengan tepat kerana kebayakan trader hanya berdasarkan setakat apa yang mereka berani sahaja, melainkan mereka memang cekap dan sanggup Membuat garisan FIBONACI ataupun ANDREW PITCHFORK dan sebagainya. Adakah anda sanggup?
Jadi bagi memudahkan anda justeru itu didalam indicator jutawanforex semuanya telah Disediakan untuk kemudahan anda, sehingga diringkaskan agar anda tidak perlu lagi melihat pegerakan indicator yang sukar untuk anda faham sebelum ini.