305# Trend Envelopes & Parabolic Structure (MT5)
Maximo Trader 2025
Trend Envelopes & Parabolic Structure (MT5) is atrend reversal strategy for MT5.
It works best on volatile currency pairs and is optimized for M15 and M30, with confirmation allowed from M5 or higher.
The strategy focuses on price exhaustion and reversals
around dynamic trend boundaries.
The Hull Butterfly oscillator is used
only as visual/confirmation (decorative) and
not as a primary trigger.
Market Conditions
-
Best markets: volatile pairs (GBPUSD, GBPJPY, EURJPY, XAUUSD, NAS100, etc.).
Avoid low-volatility Asian ranges.
Works best during London and New York sessions.
Timeframes
-
Main timeframe: M15 or M30.
Lower confirmation: M5 or higher.
Indicators (Default Settings)
-
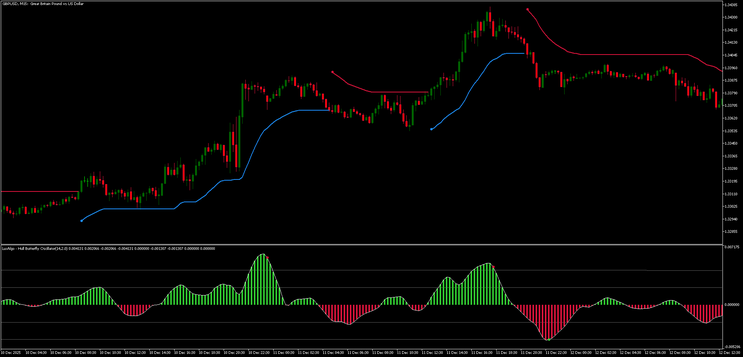
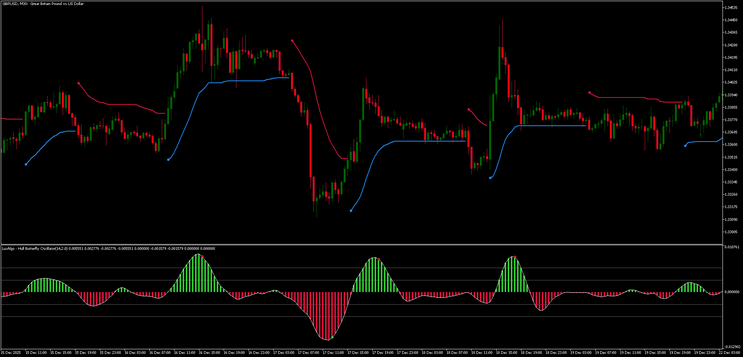
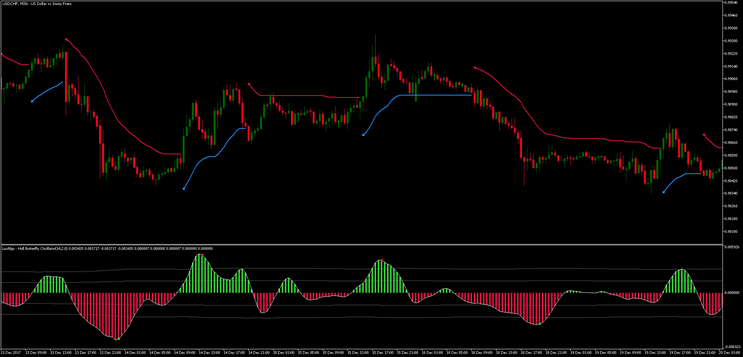
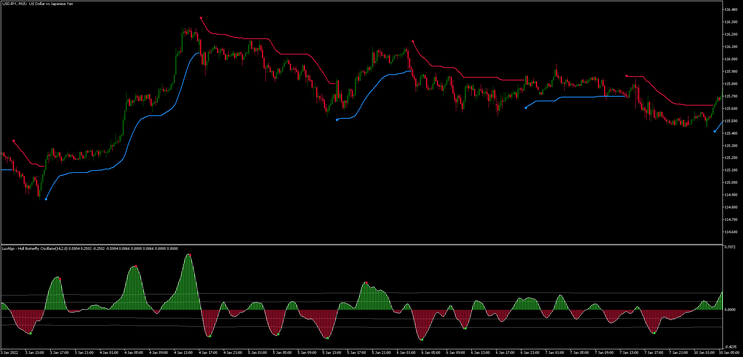
Trend Envelopes (dynamic support & resistance)
-
Parabolic-based trend line (red = resistance, blue = support)
-
Hull Butterfly Oscillator (visual momentum & exhaustion only)
Strategy Logic (Based on the Chart)
The strategy trades counter-trend reversals after trend exhaustion.
BUY (Reversal Long Setup)
Conditions:
-
Price is below the upper trend envelope and stretches toward the lower envelope
-
Price rejects the lower envelope with:
-
Long lower wicks
-
Strong bullish candle or engulfing pattern
-
-
Parabolic line is above price (downtrend losing strength)
-
Price closes above the blue parabolic support line
-
Hull Butterfly oscillator:
-
Deep red zone
-
Histogram starts decreasing (loss of bearish momentum)
-
Entry:
-
Buy at the close of the confirmation bullish candle
-
Or on a small pullback after the close
Stop Loss:
-
Below the recent swing low,
Or slightly below the lower envelope.
Take Profit:
-
First target: middle of the envelope.
Second target: upper envelope.
Optional trailing stop following the blue parabolic line.
SELL (Reversal Short Setup)
Conditions:
-
Price is above the lower trend envelope and stretches toward the upper envelope
-
Price rejects the upper envelope with:
-
Long upper wicks,
Strong bearish candle or engulfing pattern,
-
-
Parabolic line is below price (uptrend losing strength),
-
Price closes below the red parabolic resistance line,
-
Hull Butterfly oscillator:
-
Deep green zone,
Histogram starts decreasing (loss of bullish momentum).
-
Entry:
-
Sell at the close of the confirmation bearish candle.
Or on a minor retracement.
Stop Loss:
-
Above the recent swing high.
Or slightly above the upper envelope.
Take Profit:
-
First target: middle of the envelope.
Second target: lower envelope.
Optional trailing stop following the red parabolic line.
305# Forex LukeB Strategy
Submit by Janus Trader ( Written by LukeB) 17/02/2012
Time frame daily (4H maybe ok.dont use other tfs)
indicator 1 EMA 365 (above bulls and below bears as you know).
indicator 2 zigzag to find stop loss (default settings)
indicator 3 Forex LuKeB with arrow alert(designed by LukeB)
simple rules---->(1)if price action is above the ema only consider the green buy arrows.
(2)if price action is below the ema only consider the red sell arrows.
(3)stop loss-->recent high/low of zigzag.(some
times use the same ema)
(4)take profit-->it is up to you.(half of sl,same as sl or1.5x of sl etc.)
(5)use your own money management rules.