319# Ultimate Trend Signals Strategy
Janus Trader 2026
The Ultimate Trend Signals Strategy is a short-term momentum trading method designed for MetaTrader 4 (MT4). It combines multi-timeframe trend analysis with visual arrow confirmations and a trading dashboard to identify high-probability intraday setups.
This strategy is optimized for volatile currency pairs, where strong directional movements occur frequently and momentum continuation patterns are common.
The method is simple:
-
Identify higher-timeframe direction (H1),
Execute entries on M5,
Confirm with dashboard strength + arrow signals.

Setup
Time Frames
-
Primary Execution Time Frame: M5.
Higher Time Frame Confirmation: H1
Recommended Currency Pairs (Volatile. Pairs)
-
GBPJPY,
GBPAUD,
XAUUSD,
EURAUD,
NAS100 / US30 (if available on MT4 broker).
High volatility improves signal quality because the system is momentum-based.
Indicators (MT4)
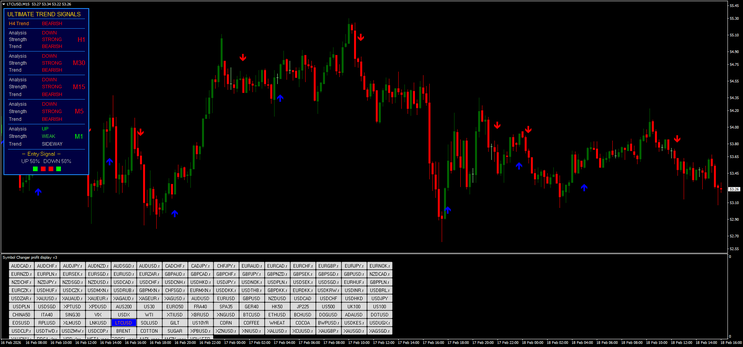
1. Trading Dashboard (Multi-Timeframe Trend Panel)
The dashboard displays:
-
H4 Trend,
H1 Trend,
M30 Trend,
M15 Trend,
M5 Trend,
M1 Trend,
Strength (Strong / Weak),
Direction (Bullish / Bearish / Sideway),
Entry Signal Percentage (UP% vs DOWN%).
This is the core filter of the strategy.
2. Arrow Buy/Sell Indicator
-
Blue Arrow = Buy Signal
Red Arrow = Sell Signal
Arrows appear at local pullbacks or reversal points aligned with short-term momentum.
Market Logic Behind the Strategy
From the screenshots:
-
When H1 shows STRONG BEARISH and DOWN analysis, the M5 tends to produce repeated red arrow signals during pullbacks.
When H1 trend is BULLISH or MEDIUM UP, M5 produces blue arrows at retracement lows.
Best trades occur when:
-
Higher timeframe direction agrees.
M5 aligns with dashboard.
Arrow appears after a pullback (not at overextended candles).
-
The strategy is therefore trend continuation after retracement, not breakout chasing.

Trading Rules
BUY Rules (Long Setup)
Step 1 – Higher Timeframe Confirmation (H1)
-
H1 Trend = Bullish.
Strength = Strong or at least not Weak.
Analysis = UP or supportive bias.
Avoid buys if H1 is strongly bearish.
Step 2 – Alignment on M5
-
M5 Trend = Bullish or turning Bullish.
Entry Signal % shows higher UP percentage (e.g., 50%+ UP).
Market structure: Higher lows forming.
Step 3 – Arrow Confirmation
-
Wait for a Blue Arrow on M5.
Prefer arrow after a pullback or small consolidation.
Do NOT enter after a large impulsive green candle.
Entry
-
Enter at the close of the arrow candle.
Or at minor retracement of that candle.
Stop Loss
-
Below the most recent swing low.
Or 10–20 pips (depending on pair volatility).
Take Profit
Option 1: 1:2 Risk/Reward.
Option 2: Previous resistance.
Option 3: Trail stop after 10–15 pips profit.

SELL Rules (Short Setup)
Step 1 – Higher Timeframe Confirmation (H1).
-
H1 Trend = Bearish.
Strength = Strong.
Analysis = DOWN.
This is crucial. The best short setups in the screenshots occurred when H1, M30, and M15 were all strongly bearish.
Step 2 – Alignment on M5
-
M5 Trend = Bearish.
Entry Signal % shows higher DOWN percentage (e.g., 70% DOWN).
Structure shows lower highs forming.
Step 3 – Arrow Confirmation
-
Wait for a Red Arrow.
Prefer entry after pullback to minor resistance.
Avoid entering after large red breakout candle.
Entry
-
Sell at candle close of the red arrow.
Or slight pullback into that candle.
Stop Loss
-
Above recent swing high.
Or volatility-based stop (pair dependent).
Take Profit
Option 1: 1:2 Risk/Reward
Option 2: Previous support level
Option 3: Trail stop during strong momentum.
Trade Filtering Rules (Very Important)
Avoid trades when:
-
Dashboard shows mixed signals across timeframes;
H1 is sideways;
Strength is weak on higher timeframe;
Major news release is imminent;
Market is low volatility (Asian session for some pairs).
Best trades occur when:
-
H1 + M30 + M15 agree;
Strength = STRONG;
M5 gives pullback arrow in direction of trend.

Example from Screenshots
Example 1 – Strong Bearish Environment
-
H1 = STRONG BEARISH
M30 = STRONG BEARISH
M15 = STRONG BEARISH
M5 = Bearish
Red arrows appear at pullbacks → price continues downward.
High probability continuation trades.

Example 2 – Medium Up H4 with Bearish Lower TF
When H4 is up but H1/M30 are strongly bearish:
-
Short trades on M5 still valid
-
But targets should be conservative
Always prioritize H1 over H4 for intraday trading.

Conclusions
The Ultimate Trend Signals Strategy is a structured trend-following system based on:
-
Multi-timeframe alignment;
-
Dashboard strength confirmation;
-
Pullback arrow entry.
It works best on volatile pairs and during active sessions (London & New York).
The key is discipline:
-
Trade only in direction of H1;
Wait for pullback;
Follow dashboard strength;
Respect risk management.
When applied consistently, this strategy provides:
-
Clear structure;
Visual confirmation;
High-probability continuation setups.
319# STLM Breakout Trading System
Breakout Trrading System with SDX Zone Breakout and STLM indicator
Indicators:
Fib pivot V.2;
SDX Zone Breakout;
STLM hist;
Long Entry:
Place an order to buy at the most recent resistance indicator sdz zone breakout dots. Enter long if STLM indicator is doger blue.
Option (long entry only if the price is > fibo pivot level.
Short Entry:
Place an order to buy at the most recent support indicator sdz zone breakout dots. Enter short if STLM indicator is white.
Option (long entry if the price is<fibo pivot level.
Exit Position:
Place stop loss 25-30 pips.
Exit position on fibo level or with predeteminate Target Profit.
In the pictures STLM Breakout forex system in action.
Breakout Zone Trading System