306# ORB + FVG Trading Strategy for MT4
Maximo Trader 2026
The ORB + FVG Strategy combines the Opening Range Breakout (ORB) with Fair Value Gap (FVG) imbalances to identify high‑probability continuation trades. The Opening Range defines the initial volatility and directional bias of the session, while FVGs provide refined entry zones aligned with institutional order flow. This strategy is designed for traders who want a mechanical, repeatable framework that avoids noise and focuses on structural precision.
2. Setup
Indicators
-
ORB Indicator (Opening Range High/Low)
FVG detection tool (optional, can also be marked manually)
MT4 standard tools: horizontal lines, rectangles, session separators
Chart Requirements
-
Clean chart
No oscillators
Only structure, range, and imbalance
3. Timeframe
-
5‑minute chart or higher (M5, M15, M30, H1 all valid depending on volatility)
4. Currency Pairs
-
Any pair
Works best on pairs with consistent volatility (e.g., GBPUSD, USDJPY, XAUUSD: any.)
5. Trading Rules
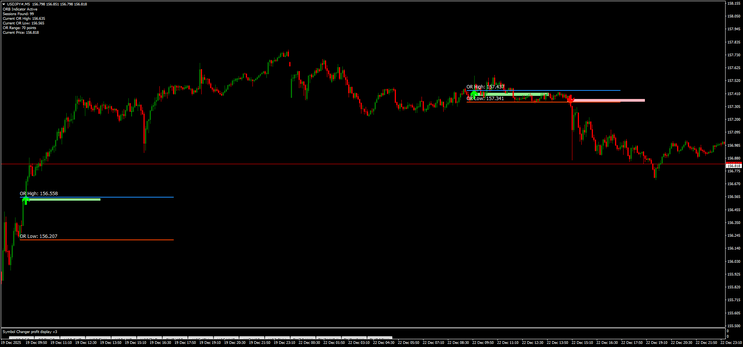
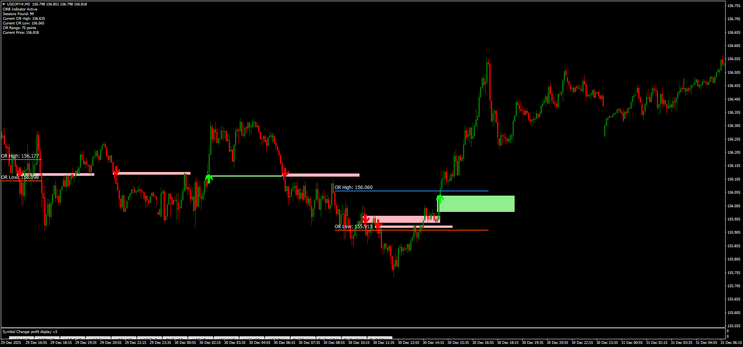
A. Define the Opening Range
-
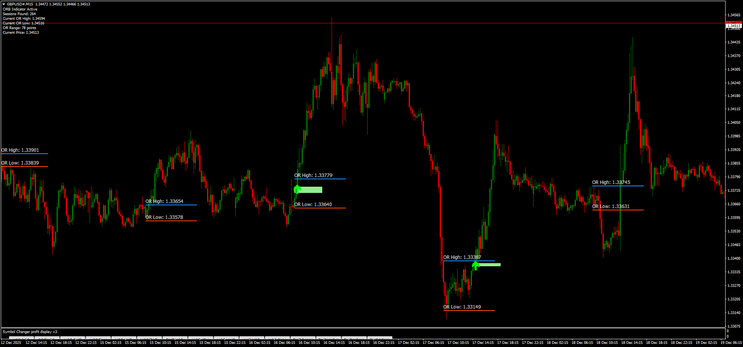
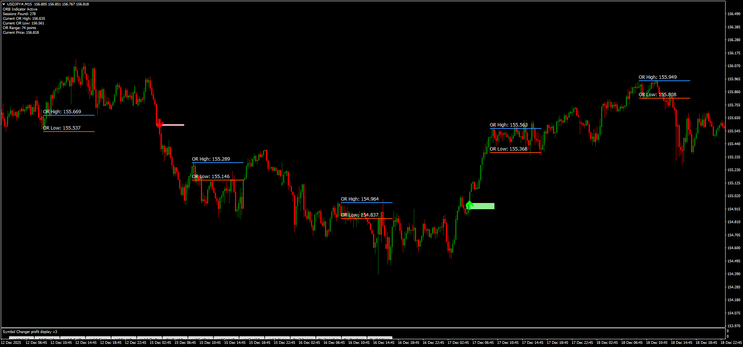
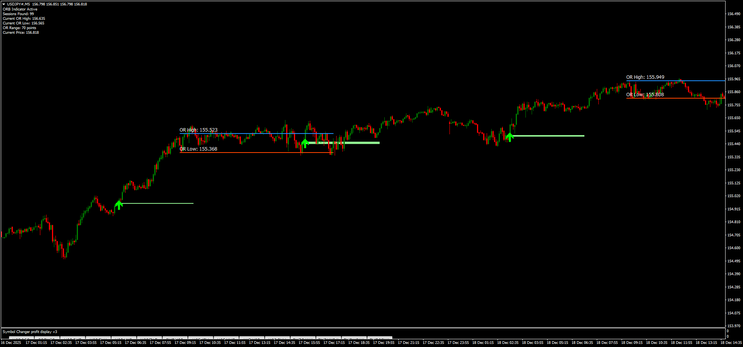
Identify the OR High and OR Low using the first 15–30 minutes of the session (depending on your ORB indicator settings).
-
Mark:
-
OR High (blue line)
OR Low (red line)
-
-
Wait for price to break out of the range.
B. Determine Directional Bias
-
Bullish Bias: Price breaks above OR High with a strong candle close.
Bearish Bias: Price breaks below OR Low with a strong candle close.
No close = no bias. No bias = no trade.
C. Identify the FVG (Fair Value Gap)
After the breakout:
-
Look for a 3‑candle imbalance in the direction of the breakout.
-
The FVG becomes your retracement entry zone.
-
Mark the FVG boundaries with a rectangle.
D. Entry Rules
Long Setup
-
OR High is broken with a bullish close.
-
Price pulls back into a bullish FVG formed after the breakout.
-
Enter long at the midpoint or lower boundary of the FVG.
-
Stop‑loss:
-
Below the FVG,
Or below OR High (conservative).
-
Short Setup
-
OR Low is broken with a bearish close.
-
Price pulls back into a bearish FVG formed after the breakout.
-
Enter short at the midpoint or upper boundary of the FVG.
-
Stop‑loss:
-
Above the FVG,
Or above OR Low (conservative).
-
E. Take‑Profit Rules
Use one or more of the following:
-
TP1: 1:1 RR,
TP2: Next liquidity level (previous high/low),
TP3: Opposite side of the next FVG,
Optional: Trail stop behind structure.
F. Invalidations
Avoid trading when:
-
Price breaks OR but immediately returns inside (fake breakout),
FVG forms inside the OR (not valid),
Spread is too high,
Major news within 5 minutes.
6. Conclusion
The ORB + FVG Strategy is a structured, mechanical approach that blends session volatility with institutional imbalance logic. The Opening Range gives you direction; the FVG gives you precision. This combination filters noise, avoids emotional entries, and creates a repeatable system suitable for any liquid market and any session. Use it consistently, track your data, and refine the timing of your entries to match your personal rhythm and market of choice.
306# IchiBrain Trading System
Submit by MavenTrader 18/02/2012 (Source TSD-forum)
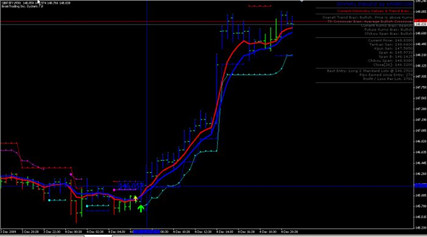
This forex strategy is a fusion of three forex trading systems : BrainTrend 7.1, Ichi360 System from ichi360.com and Double EMA Crossover. The attached image is the example chart you should be able to get by combining indicators.
Trading setup :
LONG :
Look for Blue/Cyan lines below the price and be careful if both Blue/Cyan and Red/Magenta are contradicting each other, and ge utterly careful when the bars are green. I don't trade in these conditions.
The double EMA crossover should confirm the bullish move, wait for a BIG GREEN ARROW UP, you can ignore the small ones.
At this point you can enter the trade, but if your not greedy and looking for consistency wait for Ichi360 indicator to confirm the bullish bias , the ichi360 indicator gives you exact entry point and you can use the BrainTrend indicator as trailing stop levels or exit, OR you can just wait for ichi360 to make a move in the other direction to exit.
SHORT :
Look for Red/Magenta lines above the price and be careful if both Blue/Cyan and Red/Magenta are contradicting each other, and ge utterly careful when the bars are green. I don't trade in these conditions.
The double EMA crossover should confirm the bearish move, wait for the BIG RED ARROW DOWN, you can ignore the small yellow ones.
At this point you can enter the trade, but if your not greedy and looking for consistency wait for ichi360 indicator to confirm the bearish bias, the ichi360 indicator gives you exact entry point and you can use the BrainTrend indicator as trailing stop levels or exit, OR you can just wait for ichi360 to make a move in the other direction to exit.
In the picture IchiBrain forex system in action.
SharkD1-Manual-Trading-System