


310# TDI and TMA Bands Trading Strategy (MT5 and TradingView)
Joy22 2026
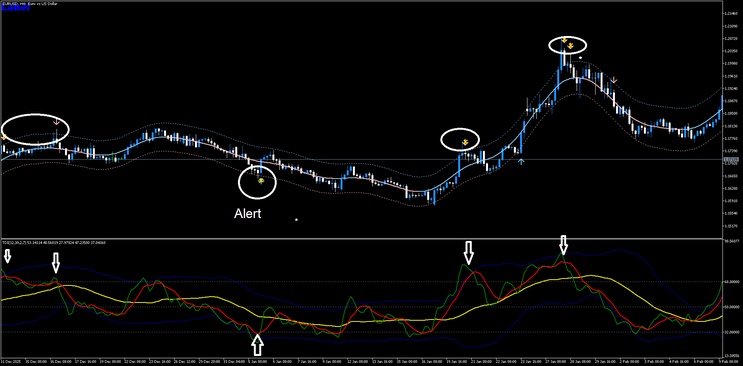
This strategy integrates the Traders Dynamic Index with Triangular Moving Average bands to create a structured and disciplined trading approach. The TMA bands define market context by identifying areas of overextension and potential reversal, while the TDI provides precise timing through momentum shifts. The arrows generated by the TMA act as alerts, highlighting zones where price is statistically stretched. They are not entry signals by themselves but serve as a trigger for attention. The actual entry is confirmed only through the behavior of the TDI.
Setup
The strategy is designed for timeframes of fifteen minutes or higher, with optimal performance typically observed on M15, M30, and H1. It is best applied to volatile instruments such as major forex pairs, gold, or indices.
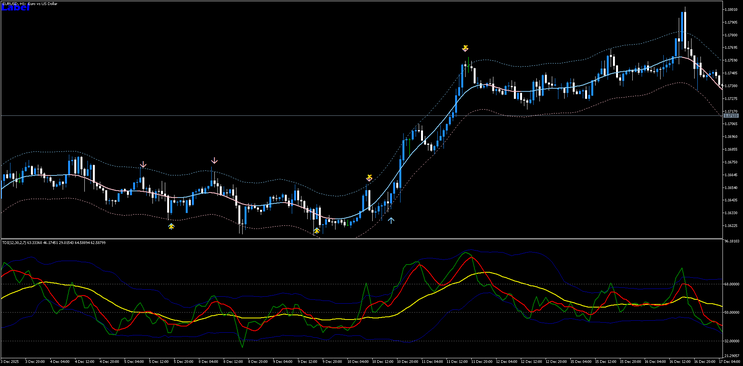
The chart must include TMA bands with upper and lower envelopes, optionally a midline, and visual arrows that indicate potential reversal zones. The TDI must include the green line representing price momentum, the red line as the signal line, and the yellow line as the market baseline.
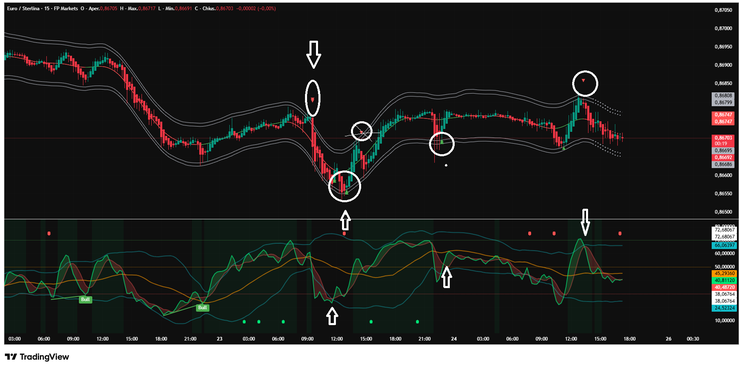
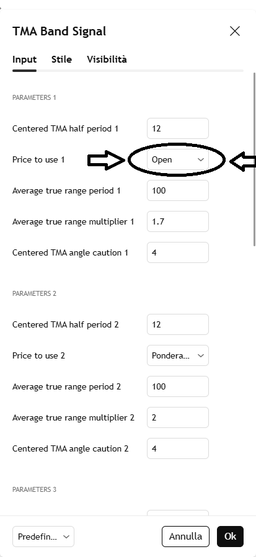
On TradingView, if Heiken Ashi candles are used, it is recommended to set the price source to open in order to stabilize the TMA calculation and reduce noise.
Trading Rules
Market Context
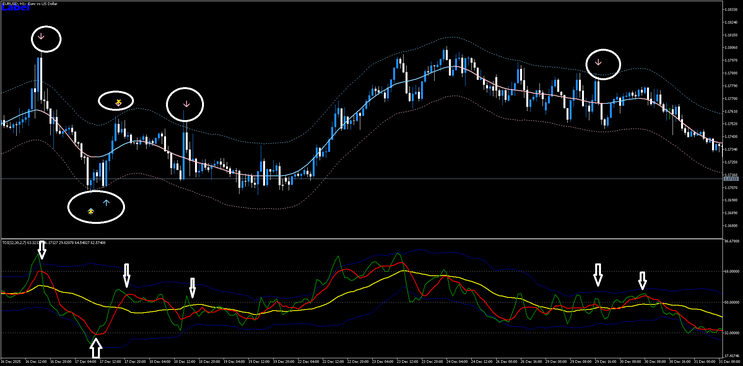
A trade is considered only when price reaches or exceeds the outer TMA bands and a corresponding arrow appears. This condition identifies a potential exhaustion point. The upper band defines a potential sell area, while the lower band defines a potential buy area. No trade is taken without this initial context.
Buy Conditions
A buy setup forms when price touches or moves beyond the lower TMA band and a TMA arrow signals a potential reversal zone. The trader must then wait for confirmation from the TDI. The green line must cross above the red line, indicating a shift in momentum. Subsequently, both lines should move upward toward or above the yellow line, confirming broader market alignment.
The entry is executed at the close of the candle where the crossover is clearly established and the slope of the green line is upward. Additional confirmation may come from bullish candle structure or rejection wicks near the lower band, reinforcing the likelihood of reversal.
Sell Conditions
A sell setup develops when price reaches or exceeds the upper TMA band and a TMA arrow highlights a potential exhaustion area. Confirmation is again required from the TDI. The green line must cross below the red line, signaling a downward momentum shift. Ideally, both lines continue below the yellow line, confirming bearish conditions.
The trade is entered at the close of the candle where the crossover is confirmed, with the green line clearly sloping downward. Additional confirmation can be observed through bearish rejection candles or upper wicks indicating failed continuation.
Exit Management
Take profit can be set conservatively at the TMA midline or more aggressively at the opposite band. Alternatively, a fixed risk to reward ratio such as one to one point five or one to two may be used depending on the trader’s preference.
Stop loss should be placed beyond the most recent swing high or low, or slightly outside the TMA band to allow for normal price fluctuation.
Conclusions
This strategy operates on the combination of mean reversion and momentum confirmation. The TMA bands identify where price is statistically extended, while the TDI confirms when momentum begins to reverse. The arrows serve only as alerts and must always be validated by the TDI before entering a trade.
The strength of this approach lies in patience and alignment. The trader waits for price to reach an extreme and only acts when momentum confirms the reversal. In essence, the TMA defines where to look, and the TDI defines when to act.

310# Dolly 13 Trading System
Submit by Maximo Trader
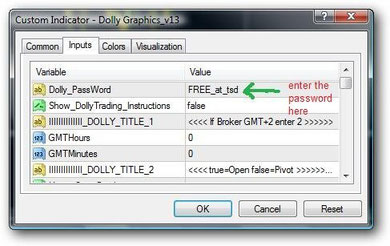
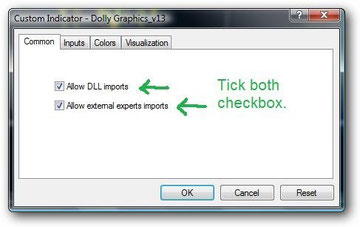
This indicator has had a total rebuild and now works with the new extra digit platforms. Dolly now also has Murrey Math 3 MA displays and Bands plus trading signals and many more features built into the code. Most important is the user needs to check the Allow DLL imports tab and put aPassword into the Dolly inputs before it will work. Dolly Password = FREE_at_tsd
Dolly V.13
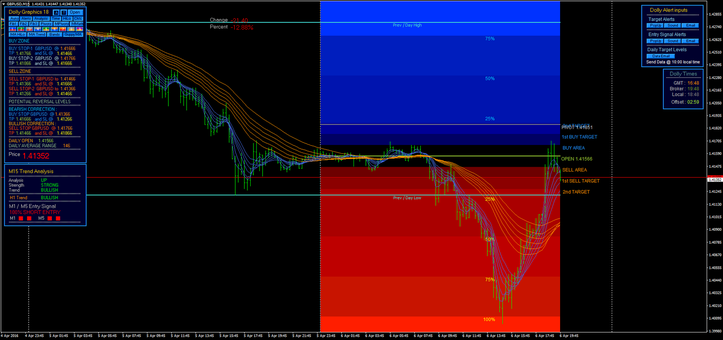
Dolly Graphics v18
Dolly Graphics v18 is last version of the popular visual trading system. Dolly Graphics 18 run on metatrader MT4 950 and above build platforms. the author of this strategy has written some functions.
The main functions:
Auto, Alerts, Analysis Time, HiLo, Fib Pivots, Murrey Math,
MA hilo, Ma Trend, Bands and Guppy.
Potential reversal correction.
All the built in Dolly indicators and changing of the color schemes plus a sophisticated set of Alerts is now available for the Dolly Targets and the Entry Signals directly off the chart with a single click of the appropriate button.
The best time frame for trading is 15 min.
Financial Markets: Forex, Indices, Commodities.
Dolly Password = FREE_at_tsd
190# DOLLY + ISAKAS + NINA - Forex Strategies - Forex
284# ISAKAS CS - Forex Strategies - Forex Resources - Forex ...
53# Isakas Sekelper - Forex Strategies - Forex Resources - Forex
172# ISAKAS Rebirth - Forex Strategies - Forex Resources - Forex
173# Trading System, ISAKAS II V.2 - Forex Strategies - Forex ...
171# ISAKAS II - Forex Strategies - Forex Resources - Forex
165# Isakas Osentogg - Forex Strategies - Forex Resources -
335# Dolly 10,11,12 - Forex Strategies - Forex Resources - Forex
190# DOLLY + ISAKAS + NINA - Forex Strategies - Forex
310# Dolly 13 - Forex Strategies - Forex Resources - Forex Trading
257# Dolly 2 - Forex Strategies - Forex Resources - Forex Trading
32# Dolly Modified - Forex Strategies - Forex Resources - Forex ...
318# Ultima Secret V.1 - Forex Strategies - Forex Resources -
339# Gold Miner and Stochbars Strategy - Forex Strategies - Forex
20# Fx Faizumi - Forex Strategies - Forex Resources - Forex
Trading System Metatrader 4 III
