


302# Apex Trend & Liquidity Master Indicator
Janus Trader 2025
The Apex Trend & Liquidity Master is a complete trading indicator designed to help traders identify market trend, key liquidity zones (support and resistance), and high‑probability buy and sell signals. It combines trend analysis, volatility, volume, and market structure into a single, easy‑to‑read tool.
This article explains how to use the indicator step by step, in a simple and practical way. You can later add screenshots to visually support each section.
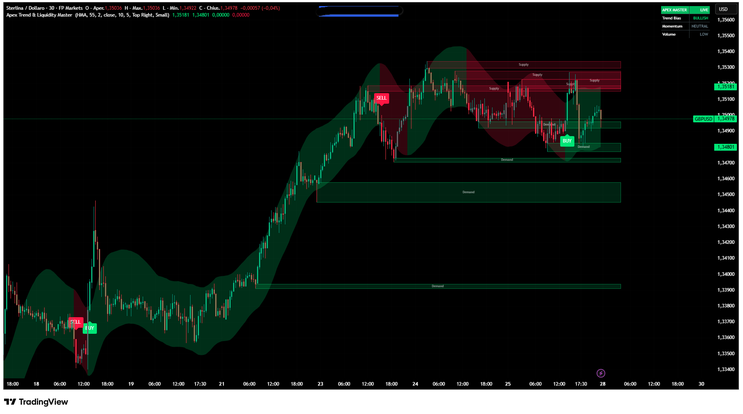
1. Understanding the Trend Cloud
The core of the indicator is the Trend Cloud.
What it does
-
It uses a moving average (EMA, SMA, HMA, or RMA)
It adds volatility bands based on ATR
This creates a dynamic cloud around price
How to read it
-
Bullish trend: Price closes above the upper band
Bearish trend: Price closes below the lower band
Neutral / consolidation: Price stays inside the cloud
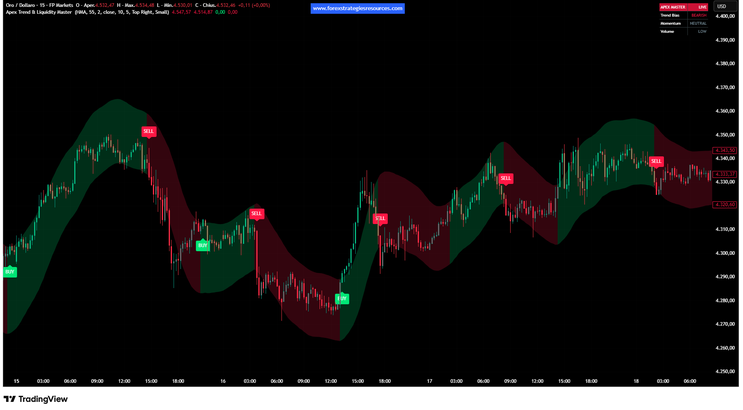
Visual cues
-
Green cloud and candles → bullish market
Red cloud and candles → bearish market
Grey candles → ranging or choppy market
Best practice: Only look for buy trades in bullish trends and sell trades in bearish trends.
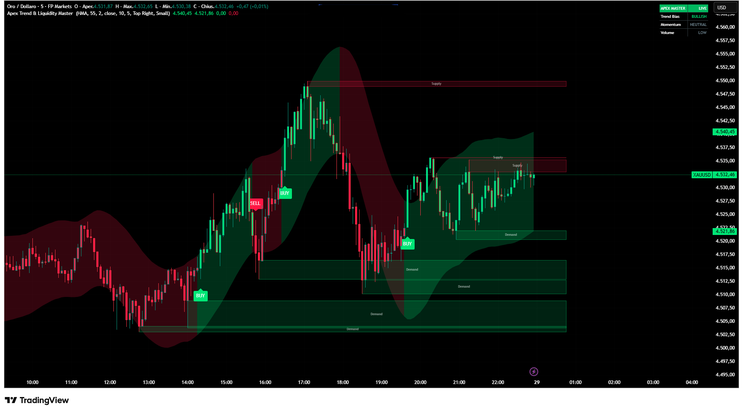
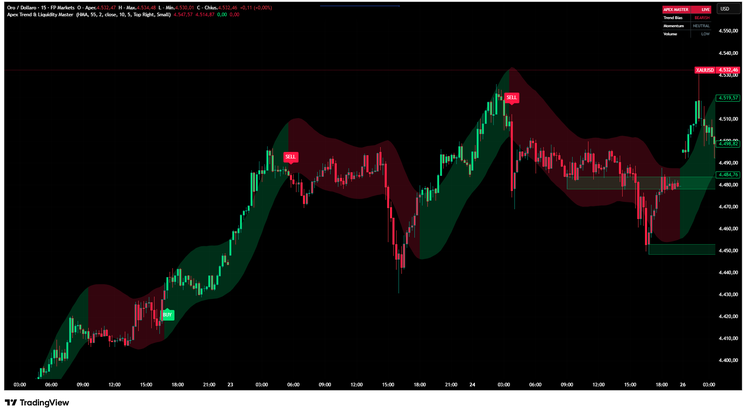
2. Buy and Sell Signals
The indicator automatically plots BUY and SELL labels on the chart.
Buy signal conditions
-
Trend changes from neutral or bearish to bullish
-
Price breaks above the upper cloud
-
Optional volume and RSI filters are satisfied
Sell signal conditions
-
Trend changes from neutral or bullish to bearish
-
Price breaks below the lower cloud
-
Optional volume and RSI filters are satisfied
How to use signals
-
Use signals as confirmation, not alone
-
Always trade in the direction of the main trend
-
Combine signals with support and resistance zones
3. Smart Liquidity Zones (Supply & Demand) Optional
The indicator automatically detects liquidity zones based on swing highs and lows.
Supply zones (Resistance)
-
Created from strong swing highs
-
Shown as red shaded boxes
-
Represent areas where selling pressure may appear
Demand zones (Support)
-
Created from strong swing lows
-
Shown as green shaded boxes
-
Represent areas where buying pressure may appear
How to trade liquidity zones
-
Look for buy signals near demand zones
-
Look for sell signals near supply zones
-
Zones are removed once price clearly breaks them
These zones help you understand where big players may enter or exit the market.
4. Volume and RSI Filters
The indicator includes optional filters to improve signal quality.
Volume filter
-
Signals appear only when volume is above average
-
Helps avoid low‑liquidity and fake breakouts
RSI filter
-
Prevents buys in overbought conditions
-
Prevents sells in oversold conditions
You can enable or disable these filters in the settings depending on your trading style.

5. Dashboard (HUD)
The dashboard gives you a quick overview of market conditions.
It shows:
-
Current trend direction (Bullish or Bearish)
Momentum strength based on RSI
Volume state (High or Low)
This allows you to make fast decisions without analyzing multiple indicators.
6. Recommended Trading Workflow
A simple way to use the indicator:
-
Identify the main trend using the cloud
-
Mark nearby supply and demand zones
-
Wait for a BUY or SELL signal in trend direction
-
Enter near a liquidity zone if possible
-
Manage risk using stop loss and take profit
7. Best Markets and Timeframes
The Apex Trend & Liquidity Master works well on:
-
Forex
Indices
Crypto
Commodities
Recommended timeframes:
-
15M for intraday trading
1H – 4H for swing trading
Daily for position trading
Final Notes
This indicator is designed to simplify market analysis by combining trend, structure, and momentum in one tool. It does not predict the future but helps you trade with discipline and structure.
Always combine it with proper risk management and avoid over‑trading.


302# CCI 50 Strategy Trading System
Submit by Leon Trader 15/02/2012
Currency pairs:all
Time frame 15min,30min, 60 min,240min.
Indicators:
34EMA
DoubleCCI
Entry : buy or sell at the break of the previous fractal swing. Buy if the price is above the 34 EMA and 50 CCI above the zero line. Sell if The price is below the 34 EMA and 50 CCI below the zero line.
2. Stop Loss : Put your stop-loss above or below the last fractals up or fractals down. Move your stop-loss step by step to lock your profit if you want to continue to follow the trend.
3.Target Profit : sell you can close the trade when the 50 CCI going up from below -100 level area to the above of the -100 level. For long position, close the trade when 50 CCI going down from above 100 level
CCI Forex Strategies
107# CCI, MACD, Zig Zag - Forex Strategies - Forex Resources ...
49# CCI and Stochastic Retracement - Forex Strategies - Forex ...
CCI Metatrader Indicator - Forex Strategies - Forex Resources ...
10# CCI Stochastic and MACD - Forex Strategies - Forex
58# CCI Floor Forex - Forex Strategies - Forex Resources - Forex
72# CCI Explosion - Forex Strategies - Forex Resources - Forex ...
93# CCI Trend Strategy - Forex Strategies - Forex Resources -
45# CCI and EMA - Forex Strategies - Forex Resources - Forex ...
34# CCI Floor Forex II - Forex Strategies - Forex Resources - Forex
208# Gann, CCI and MACD - Forex Strategies - Forex Resources ...
356# Trading 50 cci - Forex Strategies - Forex Resources - Forex ...
248# CCI Strategy - Forex Strategies - Forex Resources - Forex ...
187# 10 pips a day with CCI and MACD - Forex Strategies - Forex
45# CCI and EMA - Forex Strategies - Forex Resources - Forex ...
211# Scalping with 200 CCI - Forex Strategies - Forex Resources ...
302# CCI 50 Strategy - Forex Strategies - Forex Resources - Forex
9# Breakout With CCI - Forex Strategies - Forex Resources - Forex
148# Fx Sniper's Ergodic CCI System - Forex Strategies - Forex ...
16# CCI System - Forex Strategies - Forex Resources - Forex ...
