


346# ASQ Divergence Reversal System MT5
Maximo Trader 2026
The ASQ Divergence Reversal System combines multi-timeframe divergence detection with trend confirmation to identify high-probability reversal entries. The strategy focuses on Regular Divergences, which are the most reliable reversal signals, filtered by market structure and momentum strength.
This strategy works best on the H1, H4, and D1 timeframes. The recommended pairs are major forex pairs such as EUR/USD, GBP/USD, and USD/JPY, as well as Gold (XAU/USD) and major indices like US30 and NAS100. The trading style is swing trading, with positions typically held for 1 to 5 days.
Indicator Setup
ASQ Divergence Detector (Primary Indicator)
Load the indicator with these optimized settings. For the oscillator, use RSI 14 as the primary oscillator because it provides the most balanced divergence detection. Alternatively, you can use MACD (12/26/9) for stronger momentum confirmation.
For detection settings, set the swing length to 5, which is the default and provides a good balance between signal quality and delay. Set the lookback to 100 bars. Enable both regular and hidden divergences by setting Show Regular Divergences and Show Hidden Divergences to True. Set the minimum oscillator difference to 2.0 to filter out weak divergences.
For visual settings, enable Show Labels and Show Trendlines. Set the trendline style to Dotted so it is easier to distinguish from price action. Set the arrow offset to 50 points.
For alert settings, enable Alert Popup and Alert Sound. Set the alert cooldown to 300 seconds to prevent alert spam.
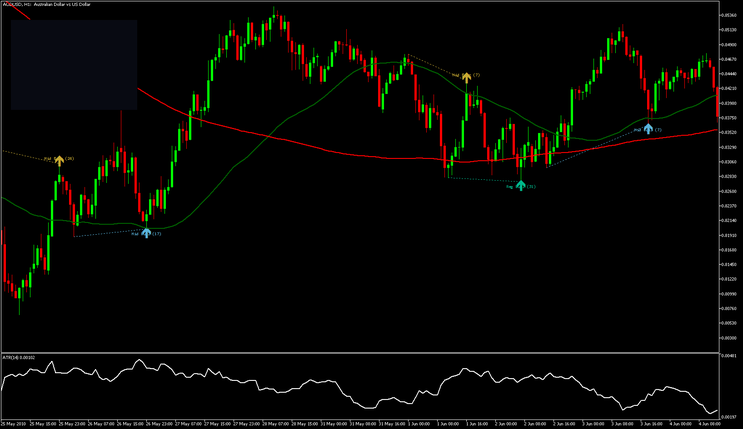
200 EMA (Exponential Moving Average)
Add a 200-period EMA applied to the close price. Set the color to red with a width of 2. The purpose of this moving average is to identify the overall trend direction.
50 EMA (Exponential Moving Average)
Add a 50-period EMA applied to the close price. Set the color to green with a width of 1. This moving average identifies the intermediate trend and acts as dynamic support and resistance.
ATR (Average True Range)
Add the ATR indicator with a period of 14. This indicator is used to calculate dynamic stop loss and take profit levels, as well as for position sizing and risk management.

Entry Rules
Long Entry (Buy Setup)
The first condition is the trend context. Price must be trading below the 200 EMA, which indicates we are in a downtrend or correction. Alternatively, price can be in a ranging market between key support and resistance levels.
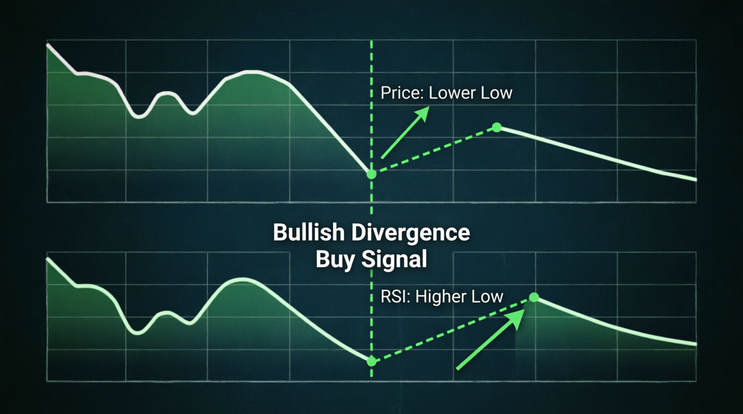
The second condition is a bullish regular divergence. The ASQ Divergence Detector must print a green "Reg Bull" arrow with a strength score of 60 or higher. The indicator automatically detects that price makes a lower low while the RSI makes a higher low, calculated internally.
The third condition is a confirmation candle. You must wait for a bullish confirmation candle to close after the divergence signal. This can be a bullish engulfing pattern, a pin bar with a long lower wick, or a strong bullish candle that closes above the previous candle's high.
The entry trigger is to enter a BUY position at the open of the next candle after the confirmation candle closes. Place the stop loss and take profit immediately according to the risk management section below.
Short Entry (Sell Setup)
The first condition is the trend context. Price must be trading above the 200 EMA, which indicates we are in an uptrend or correction. Alternatively, price can be in a ranging market between key resistance and support levels.
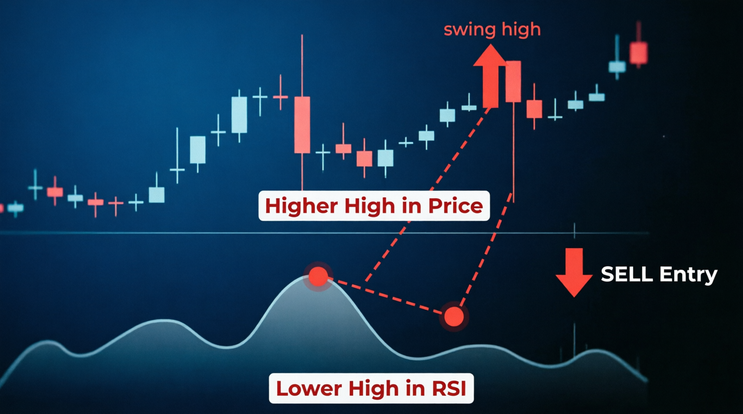
The second condition is a bearish regular divergence. The ASQ Divergence Detector must print a red "Reg Bear" arrow with a strength score of 60 or higher. The indicator automatically detects that price makes a higher high while the RSI makes a lower high, calculated internally.
The third condition is a confirmation candle. You must wait for a bearish confirmation candle to close after the divergence signal. This can be a bearish engulfing pattern, a pin bar with a long upper wick, or a strong bearish candle that closes below the previous candle's low.
The entry trigger is to enter a SELL position at the open of the next candle after the confirmation candle closes. Place the stop loss and take profit immediately according to the risk management section below.
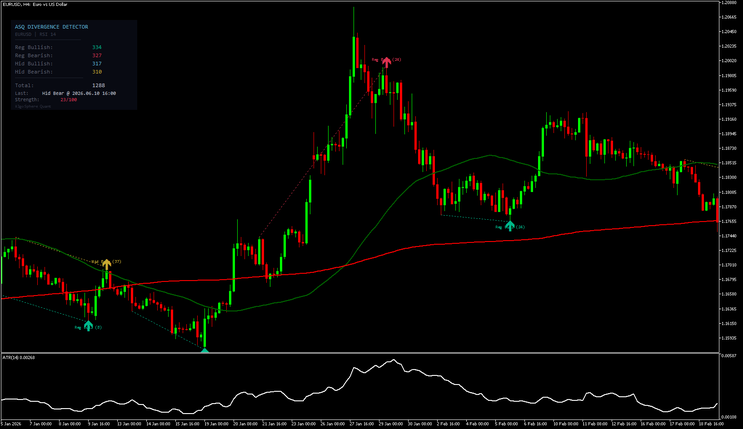
Advanced Entry: Hidden Divergence for Trend Continuation
For traders who prefer trading with the trend, hidden divergences offer excellent continuation setups.
Hidden Bullish Divergence (Trend Continuation in Uptrend)
The conditions are as follows. Price must be above the 200 EMA, indicating a strong uptrend. Price pulls back to the 50 EMA or a key support level. The ASQ Detector prints a blue "Hid Bull" arrow with a strength of 50 or higher. The indicator detects that price makes a higher low, but the RSI makes a lower low.
The entry is to buy after a bullish confirmation candle closes.
Hidden Bearish Divergence (Trend Continuation in Downtrend)
The conditions are as follows. Price must be below the 200 EMA, indicating a strong downtrend. Price rallies to the 50 EMA or a key resistance level. The ASQ Detector prints a gold "Hid Bear" arrow with a strength of 50 or higher. The indicator detects that price makes a lower high, but the RSI makes a higher high.
The entry is to sell after a bearish confirmation candle closes.
Stop Loss Placement
Use ATR-based dynamic stop loss to adapt to market volatility.
For long positions, the conservative approach is to set the stop loss at the entry price minus 2.0 times the ATR. The aggressive approach is to set it at the entry price minus 1.5 times the ATR. Alternatively, you can place the stop loss 5 to 10 pips below the most recent swing low.
For short positions, the conservative approach is to set the stop loss at the entry price plus 2.0 times the ATR. The aggressive approach is to set it at the entry price plus 1.5 times the ATR. Alternatively, you can place the stop loss 5 to 10 pips above the most recent swing high.
The most important rule is to never risk more than 1 to 2 percent of your account balance on a single trade. Adjust your position size accordingly.
Take Profit Strategy
Use a multi-target approach to maximize profits while securing gains.
For Take Profit 1, close 50 percent of your position when price reaches 1.5 times your stop loss distance. Then move the stop loss to breakeven at the entry price.
For Take Profit 2, close 30 percent of your position when price reaches 2.5 times your stop loss distance. Trail the stop loss to the Take Profit 1 level.
For Take Profit 3, close the remaining 20 percent of your position when price reaches 4.0 times the risk distance, or at the next major support or resistance level, or when price touches the 200 EMA.
An alternative exit strategy is to close the entire position if a counter-divergence appears. For example, if you are long and a strong bearish divergence forms, close the position.
Trade Management Rules
The first rule is the time-based exit. If the trade has not reached Take Profit 1 within 10 candles on your trading timeframe, close the position at market price. Divergences that do not play out quickly often fail.
The second rule is the news filter. Do not enter new trades 30 minutes before or after high-impact news events such as NFP, CPI, or FOMC. Check the economic calendar daily.
The third rule is the session filter. The best trading sessions are London (08:00 to 16:00 GMT) and New York (13:00 to 21:00 GMT). Avoid trading during the Asian session for EUR/USD and GBP/USD because of low volatility.
The fourth rule is maximum concurrent trades. You can have a maximum of 2 open positions at the same time and a maximum of 3 trades per day to prevent overtrading.
The fifth rule is the breakeven rule. Once price reaches 1.0 times the risk in your favor, move the stop loss to breakeven. This protects capital and creates risk-free trades.
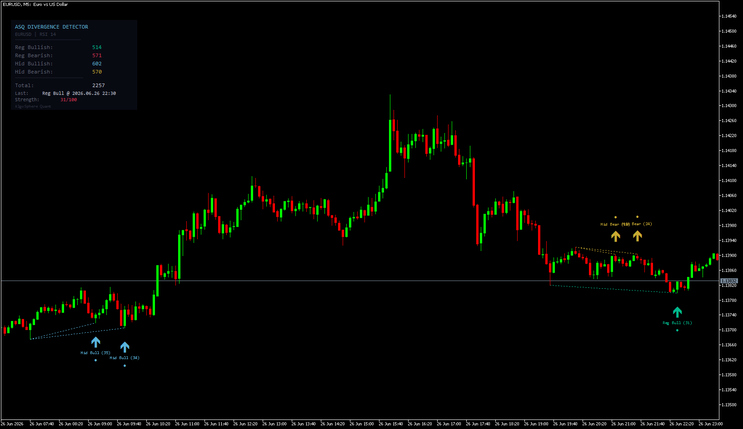
Dashboard Monitoring
The ASQ Divergence Detector includes a real-time dashboard that helps you track performance.
Monitor the total divergences, which should be 5 to 15 per day on the H1 timeframe. If there are too many, the market is too choppy. Check the last divergence type to confirm the most recent signal. Focus on the strength score, specifically signals with a strength of 60 or higher for higher probability setups.
The dashboard uses color coding for strength. Green strength (70 to 100) indicates a high probability setup. Gold strength (40 to 69) indicates a medium probability setup. Red strength (0 to 39) indicates a low probability setup, so you should avoid it or reduce your position size.
Backtesting Guidelines
Before trading live, backtest this strategy with specific parameters. Use a minimum of 6 months of historical data on the H1 or H4 timeframe. Start with an initial balance of $10,000 and risk 1 percent per trade. Use variable spread for realistic market conditions.
The expected performance metrics are a win rate of 55 to 65 percent, a risk-reward ratio of at least 1:2.0, a profit factor greater than 1.5, and a maximum drawdown below 20 percent.
If backtesting shows a win rate below 50 percent or a profit factor below 1.3, do not trade live. Optimize your parameters or reconsider the strategy.
Common Mistakes to Avoid
The first mistake is trading against strong trends. Do not take bullish divergences when price is making strong lower lows below the 200 EMA. Divergences work best at the end of corrections, not in the middle of strong trends.
The second mistake is ignoring the strength score. A divergence with a strength below 40 is weak and likely to fail. Only trade divergences with a strength of 60 or higher for the highest probability.
The third mistake is entering without confirmation. Never enter immediately when the arrow appears. Wait for the confirmation candle to close. This is non-negotiable.
The fourth mistake is moving the stop loss. Once you set your stop loss, never move it further away. You can move it closer to breakeven or profit, but never increase your risk.
The fifth mistake is overtrading. Not every divergence is a trade setup. If you do not see a clear setup with all conditions met, stay out of the market.
Example Trade Walkthrough
Here is an example of a EUR/USD H4 bearish divergence setup on March 15, 2026.
The setup begins with price trading above the 200 EMA at 1.0850, indicating an uptrend context. Price rallies to 1.0920, making a higher high from the previous swing at 1.0880. The ASQ Divergence Detector prints a red "Reg Bear" arrow at 1.0920 with a strength of 78. A bearish engulfing candle forms and closes at 1.0895.
For the entry, you sell at 1.0890 at the open of the next candle. The ATR(14) is 45 pips. The stop loss is set at 1.0890 plus 2.0 times 45, which equals 1.0980, representing 90 pips of risk. The position size is 0.2 lots, risking $180 on a $10,000 account, which is 1.8 percent risk.
For trade management, Take Profit 1 is at 1.0890 minus 1.5 times 90, which equals 1.0755. Close 50 percent at 1.0755 and move the stop loss to breakeven at 1.0890. Take Profit 2 is at 1.0890 minus 2.5 times 90, which equals 1.0665. Close 30 percent at 1.0665 and trail the stop loss to 1.0755. Take Profit 3 is at 1.0890 minus 4.0 times 90, which equals 1.0530. Close 20 percent at 1.0530.
The result is that price hits Take Profit 1 in 8 candles, so 50 percent is closed at plus 135 pips. Price hits Take Profit 2 in 15 candles, so 30 percent is closed at plus 225 pips. Price reverses at 1.0680 and triggers the trailing stop, so 20 percent is closed at plus 210 pips. The total profit is 67.5 plus 67.5 plus 42, which equals 177 pips. The risk-reward achieved is 1.97:1.
Conclusion
The ASQ Divergence Reversal System is a robust, non-repainting strategy that leverages the power of divergence detection combined with trend filtering and proper risk management.
The key takeaways are to focus on regular divergences with a strength of 60 or higher. Always wait for a confirmation candle before entering. Use ATR-based stop loss for dynamic risk management. Take partial profits at multiple targets. Never risk more than 2 percent per trade. Backtest thoroughly before going live.
Remember that no strategy wins 100 percent of the time. The edge comes from consistent execution and proper risk management over hundreds of trades.
346# Fx Contrarian Trading System
Submit by Joy22 01/06/2012
Time Frame H1
Currency pairs:any
Indicators:
envelope 233
moving average 233
lukas1 arrow
Stochastic (5,3,3)
Short Entry
Wait that the price close above the Red band, Sell the opening of the next bar when you see the red arrow Lukas, confirmed by Stoch that cross down
Long Entry
Wait that the price close above the Green band, Buy the opening of the next bar when you see the Green arrow Lukas, confirmed by Stoch that cross down.
Exit position:
at the opposite arrow;
when stoch reaches the overbought or oversold;
when the prices reaches the first line white;
predetermined profit target 15-30 pips.
Place stop loss at the previous swing.
In the pictures Fx Contrarian forex system in action.
133# 1 min Contrarian Scalping (VIII) - Forex Strategies - Forex ...
109# Contrarian - Forex Strategies - Forex Resources - Forex ...
153# Dynamic Channel, Contrarian Strategy. - Forex Strategies ...
346# Fx Contrarian - Forex Strategies - Forex Resources - Forex ...
150# Contrarian Scalping - Forex Strategies - Forex Resources ...
Contrarian with HMA and Bollinger bands
300# HMA and SMI - Forex Strategies - Forex Resources - Forex ...
124# Swing Extreme - Forex Strategies - Forex Resources - Forex
325# Past Regression Deviated Method - Forex Strategies - Forex
12# Renko with DTOSC and Past Regression Deviated - Forex ...
2# Renko with I-Regression bands - Forex Strategies - Forex ...
123# ATR Channels Strategy - Forex Strategies - Forex Resources
147# Fibo Dynamic Channel - Forex Strategies - Forex Resources
