338# How to Trade Forex Using the DXY
Janus Trader 2026
The U.S. Dollar Index (DXY) is one of the most widely followed macroeconomic indicators in financial markets, measuring the strength of the U.S. dollar against a basket of major global currencies. Originally introduced in 1973, the index reflects the relative value of the dollar compared to currencies such as the euro, Japanese yen, British pound, Canadian dollar, Swedish krona, and Swiss franc. Because the euro holds the largest weight in the index, the DXY often moves inversely to EUR/USD, making it especially useful for forex traders seeking confirmation and directional bias.

Understanding the DXY allows traders to gain insight into overall market sentiment. When the index is rising, it indicates a strengthening U.S. dollar, which often puts pressure on currency pairs like EUR/USD and assets such as gold. Conversely, when the DXY is falling, it signals dollar weakness and can support bullish moves in risk assets and major forex pairs quoted against the dollar. Rather than being traded directly in most cases, the DXY serves as a powerful analytical tool that helps traders align their positions with broader macroeconomic trends.
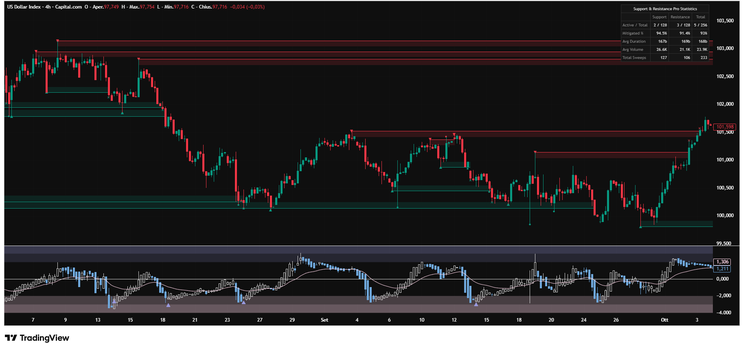
A practical trading strategy based on the DXY begins with opening its chart on a platform like TradingView, typically using the symbol TVC:DXY. Traders usually analyze higher timeframes such as the 1-hour, 4-hour, or daily chart to identify the broader trend. The first step is to determine the market structure by observing whether the index is forming higher highs and higher lows, indicating an uptrend, or lower highs and lower lows, indicating a downtrend. If the market is moving sideways, it suggests a range-bound environment where caution is required.
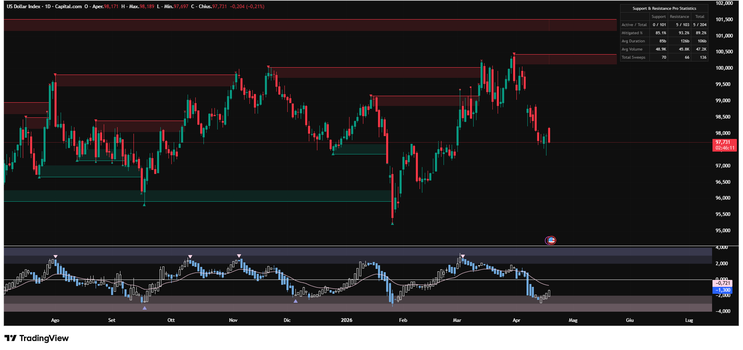
Once the trend is identified, the next step is to mark key support and resistance levels on the DXY chart. These levels represent areas where price has historically reacted and are likely to act as decision points again. The strategy revolves around waiting for the price to reach one of these levels and observing how it reacts. For example, if the DXY approaches a strong resistance level and shows signs of rejection, this could indicate potential dollar weakness. Similarly, if it reaches support and begins to bounce, it may signal renewed strength in the dollar.
After identifying a potential reaction on the DXY, the trader shifts focus to a correlated forex pair such as EUR/USD, GBP/USD, or even gold (XAU/USD). The key principle is inverse correlation: if the DXY shows signs of weakness, traders look for buying opportunities on EUR/USD, while signs of strength in the DXY encourage selling opportunities on the same pair. However, it is important not to enter trades blindly. The DXY provides directional bias, but the actual trade should be executed based on confirmation from the specific asset being traded.
Entry confirmation can come in several forms, including a break of market structure, a trendline break, or clear candlestick patterns such as engulfing candles or rejection wicks. Waiting for confirmation reduces the risk of entering too early and improves the overall probability of success. Once confirmation is present, the trader can execute the position, placing a stop loss beyond a recent swing high or low and targeting the next significant level on the chart.
Trade management is equally important. As the trade moves in profit, the stop loss can be adjusted to breakeven to protect capital. Partial profits may be taken at key levels, while the remaining position is left to run in line with the prevailing trend. This disciplined approach helps balance risk and reward while allowing traders to capitalize on strong directional moves.
A typical example of this strategy would involve the DXY reaching a resistance zone and showing a clear rejection. Anticipating dollar weakness, the trader then observes EUR/USD for a bullish signal. Once a break of structure or a strong bullish candlestick pattern appears, a long position is entered, targeting the next resistance level. This approach emphasizes confirmation and alignment rather than prediction, which is a key factor in consistent trading.
Many traders wonder whether a custom DXY indicator is necessary, especially when coming from platforms like MetaTrader 5. In reality, TradingView already offers built-in versions of the index, such as TVC:DXY, which are sufficient for most strategies. Custom indicators may provide additional flexibility, such as adjusting currency weights or creating synthetic indexes, but they are not required for effective trading.
In conclusion, the DXY is more than just an index; it is a macroeconomic compass that helps traders navigate the markets with greater clarity. By combining an understanding of market structure, key levels, and intermarket correlations, traders can develop a structured and disciplined approach to trading. The key to success lies in patience, waiting for high-probability setups, and always confirming signals before entering a trade.

Pratical Example (the logic is the same for every platform.)
A practical example of this strategy using MT5 starts with analyzing the Dollar Index (DXY) and manually drawing key support and resistance levels. As shown in the chart, the trader identifies important zones where price has previously reacted, marking horizontal levels that represent potential turning points. The goal is not to predict the market, but to wait for price to reach these areas and observe how it behaves. When the DXY approaches a resistance level and shows rejection, this suggests potential weakness in the U.S. dollar; when it approaches support and bounces, it indicates possible strength.
Once a clear reaction occurs on the DXY, the trader shifts attention to a correlated currency pair such as EUR/USD, GBP/USD, AUD/USD, or NZD/USD. At this stage, the Parabolic SAR indicator is used as a timing tool for entry. For example, if the DXY rejects resistance and starts moving downward, the trader expects dollar weakness and looks for buying opportunities on EUR/USD or similar pairs. The entry is triggered when the Parabolic SAR flips direction, confirming a potential trend change on the forex pair.
This approach combines macro context with precise entry timing. The DXY provides the directional bias, while the Parabolic SAR helps refine the exact moment to enter the trade. Stop loss is typically placed below or above recent structure, and targets are set at the next key levels. By waiting for confirmation both on the index and the currency pair, the trader avoids impulsive decisions and increases the probability of entering high-quality setups.
338# Symphonie Spike Forex System
Markrket Emotion Indicator
Submit by Janus Trader 16/05/2012
Time Frame 15min or higher
Currency pairs:all
Indicators:
Symohnie Spike
Market Emotion
Symphonie Spike indicator gives buy signal (Signal at the bottom) and sell signal (Signal at the top)
Market Emotion gives a confirmation of signal given by Spike indicator: BUY Doger Blue bar and SELL Red.
Long Entry: Symphonie Spike bottom and Market Emotion Doger Blue.
Exit positionwhen Market Emotion is red or place profit targetratio 1:2
Place your stop losson the previous swing.
Short Entry: Symphonie Spike Top and Market Emotion
Exit positionwhen Market Emotion is Doger Blue or place profit target ratio 1:2
Place your stop losson the previous swing.
In the picture Simphonie Spike forex system in action.