353# Institutional Liquidity and TMA Momentum Strategy MT5
Emiliano Quantitative Trader 2026
Institutional Liquidity and TMA Momentum Strategy MT5 is designed for MetaTrader 5 and focuses on high-probability reversals and trend continuations. It combines three distinct layers of market analysis to filter out noise. First, it uses the Liquidity Heat Map to identify key structural levels where institutional orders are likely resting. Second, it employs the Difference for Two TMA to filter the overall market direction, ensuring we only trade with momentum. Finally, the Twin Range Filter provides precise entry timing to minimize drawdown. By waiting for price to reach liquidity zones and confirming with the TMA oscillator, traders can avoid false breakouts and capture significant moves.
Indicators Configuration
Liquidity Heat Map: Used to identify Support (Green lines) and Resistance (Red lines).
Difference for Two TMA (TTT): Used as the primary trend filter in the sub-window.
Twin Range Filter: Used for entry triggers (Arrows).
Long Setup (Buy)
The market must be in a downtrend or consolidation and approach a major support level. The Liquidity Heat Map must show price interacting with the lower Green lines. Simultaneously, the Difference for Two TMA indicator in the sub-window should be at a low level, indicating oversold conditions or a potential trend change. We wait for the TMA lines to cross or turn green, signaling a shift in momentum.
Short Setup (Sell)
The market must be in an uptrend or consolidation and approach a major resistance level. The Liquidity Heat Map must show price interacting with the upper Red lines. Simultaneously, the Difference for Two TMA indicator in the sub-window should be at a high level, indicating overbought conditions. We wait for the TMA lines to cross or turn red, signaling a shift in momentum to the downside.
Trading Rules Buy
Step 1: Wait for price to touch or pierce the Green Liquidity lines (Support Zone).
Step 2: Check the Difference for Two TMA. The Green line must be rising or crossing above the Red line.
Step 3: Wait for the Twin Range Filter to print a Green Up Arrow on the candlestick.
Step 4: Enter a Buy order at the close of the signal candle.
Step 5: Place Stop Loss below the recent swing low or the Green liquidity zone.
Step 6: Take Profit at the next major Red liquidity zone or the central equilibrium line.
Trading Rules Sell
Step 1: Wait for price to touch or pierce the Red Liquidity lines (Resistance Zone).
Step 2: Check the Difference for Two TMA. The Red line must be falling or crossing below the Green line.
Step 3: Wait for the Twin Range Filter to print a Red Down Arrow on the candlestick.
Step 4: Enter a Sell order at the close of the signal candle.
Step 5: Place Stop Loss above the recent swing high or the Red liquidity zone.
Step 6: Take Profit at the next major Green liquidity zone.
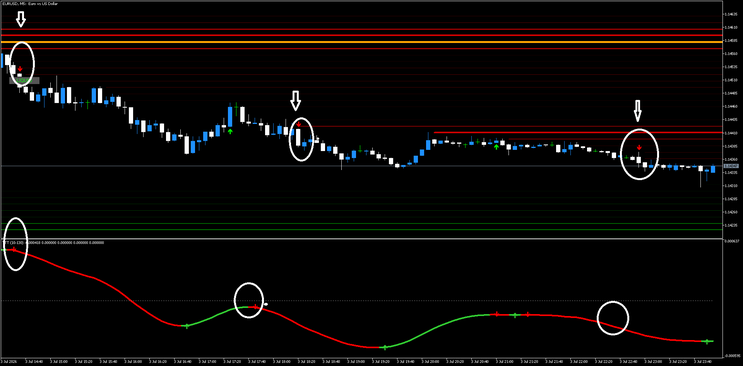
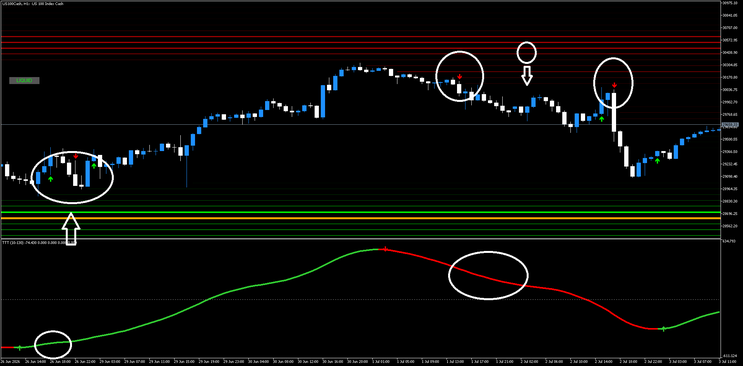
Summary of Visual Cues from Images:
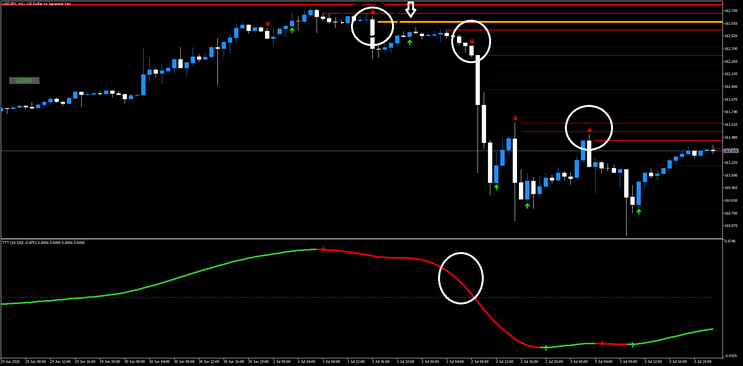
Image 1 (US100): Shows a Buy at the bottom green lines when the oscillator turns up (bottom left circle). Shows a Sell at the top red lines when the oscillator turns down (top middle circle).
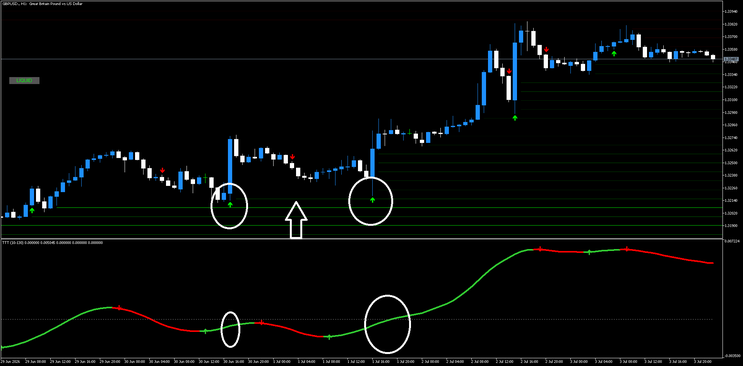
Image 2 (GBPUSD): Clearly shows a Sell when price hits the top red/yellow zone and the bottom oscillator crosses down (Red line takes over). Shows a Buy when price hits the bottom green zone and the bottom oscillator crosses up (Green line takes over).
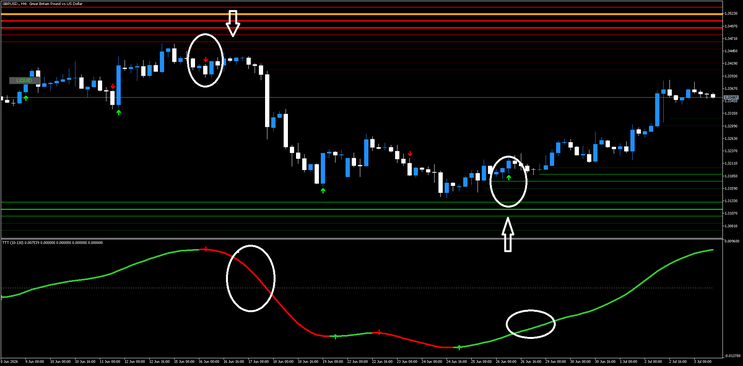
Image 3 (EURUSD): Shows multiple Sell signals (Red arrows) as the price stays below the resistance lines and the bottom oscillator remains Red/falling.
Important Note: Do not take Buy signals if the price is at the Red lines (Resistance), and do not take Sell signals if the price is at the Green lines (Support). Always trade in the direction of the Liquidity reaction.
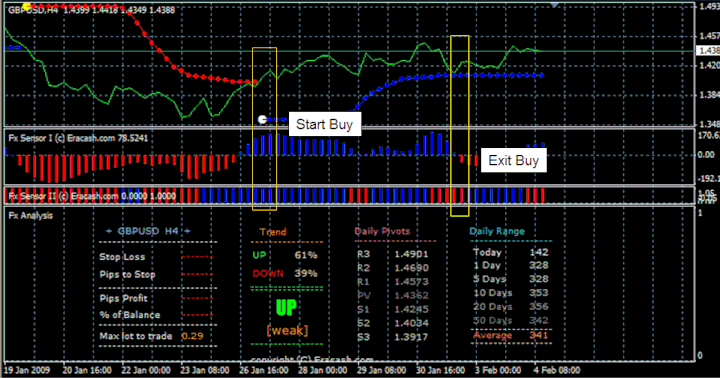
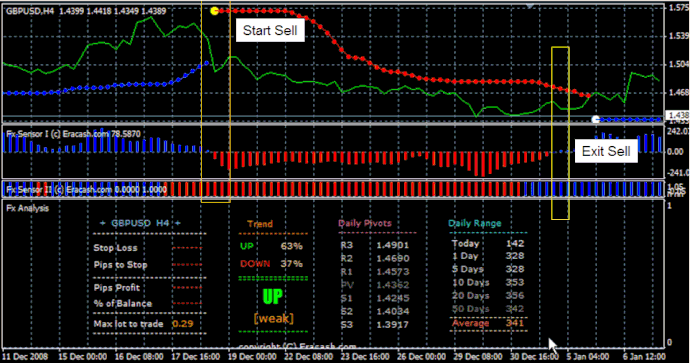
353# FX Sensor Trading System
FX Sensor
Submit by Janus Trader 19/06/2012
Time Frame 4H.
Currency pairs:any.
FX Sensor is a trend following system.
Metatrader Indicators are:
Fx analysis,
Fx explosion ,
FX Sensor I,
FX Sensor II,
FX Signal.
Fx analysis indicator indicate: Stop loss, pips stop loss, Average daily Range, levels pivot, direction % of the trend up or down, pips profit % of balance, Max lot to trade. FX Sensor I and Fx Sensor II are two trend indicators.
Buy
Fx Signal buy,
FX Sensor I blue,
FX Sensor II blue,
FX analysis Tren up >60%.
Sell
Buy
Fx Signal sell,
FX Sensor I red,
FX Sensor II red,
FX analysis Tren down >60%.
In the pictures FX Sensor forex system in action.