


177# Profitable Trend-Following with Parabolic SAR and ATR-Based Risk Management
Janus Trader 2025
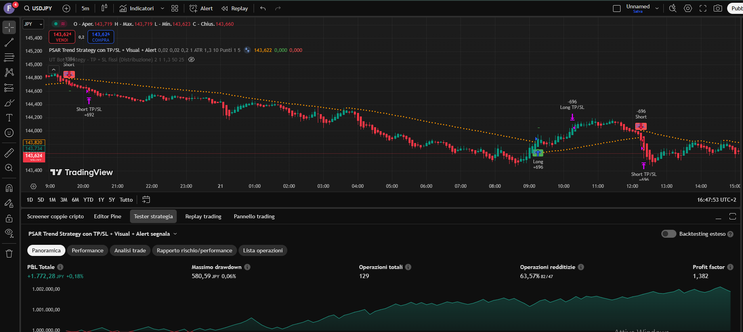
The Parabolic SAR (Stop and Reverse) indicator offers a systematic method to capture market trends, and when combined with Average True Range (ATR)-based profit targeting and stop loss, it becomes a powerful and adaptive trading system.
What Is the Parabolic SAR?
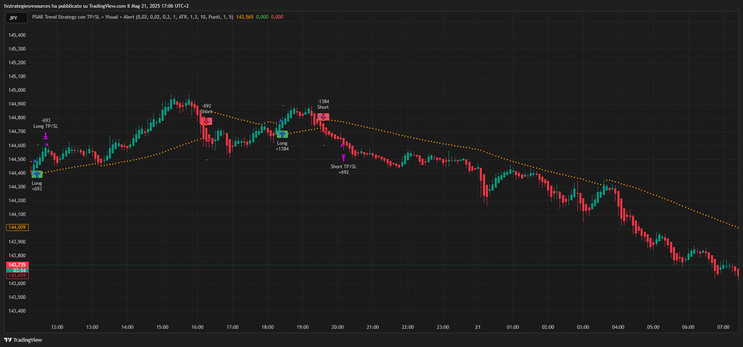
The Parabolic SAR, developed by J. Welles Wilder, is a trend-following indicator designed to identify potential reversals in the price direction. It appears as a series of dots placed above or below the price candles:
Dots below the price suggest an uptrend.
Dots above the price indicate a downtrend.
As a trend continues, the SAR trails the price more closely, acting as a dynamic stop level and signaling when the trend may be losing momentum.
Strategy Overview
This enhanced Parabolic SAR strategy builds on the original concept and adds several smart features:
Custom Trend Entry: Instead of entering a position on the first bar of a trend, traders can delay entry to the N-th bar (user-defined) for more reliable signals.
ATR-Based Take Profit & Stop Loss:
The ATR (Average True Range) is used to calculate dynamic TP and SL levels that adapt to market volatility.
This ensures risk and reward targets are proportional to current market conditions.
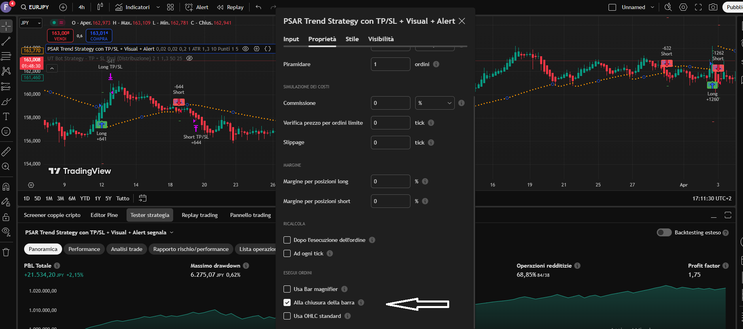
No Re-Entry Until Flat: The strategy avoids entering a new position until the previous one is fully closed, improving clarity and control.
Key Features
✅ Trend-following logic based on SAR reversal
✅ Fully parameterized inputs:
Start, increment, and max acceleration factor (AF)
Entry delay (N-th trend bar)
ATR multiplier for TP/SL
Why Use ATR for TP/SL?
Using fixed-point targets can be problematic in volatile markets. ATR solves this by scaling exits based on real-time volatility:
In quiet markets, TP and SL are tighter.
In volatile periods, they automatically expand.
This adaptive nature reduces false stops and improves consistency over time.
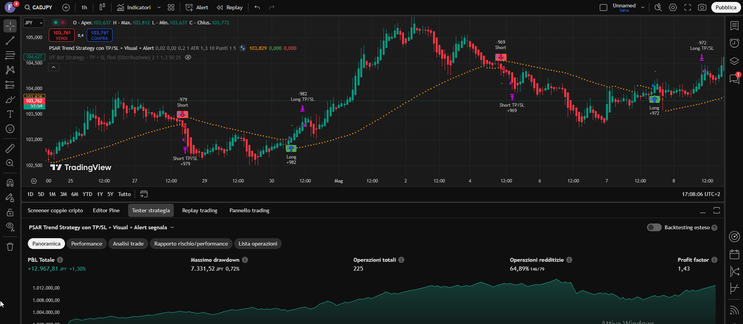
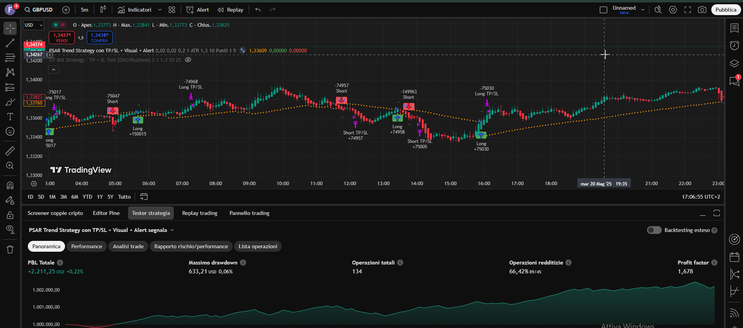
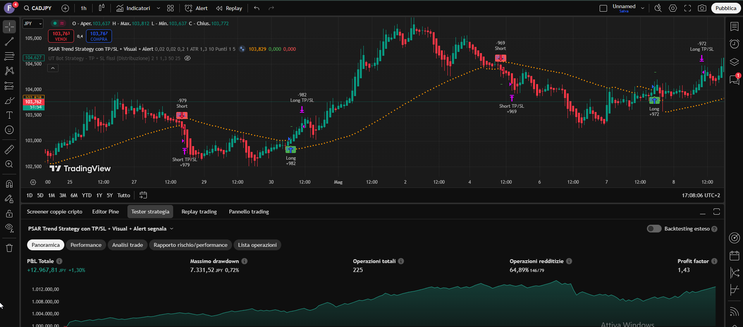
Strategy Performance and Customization
This strategy can be used on multiple timeframes (5min,15min, 1h, 4h) and is ideal for:
Trend-followers who want defined entries and exits.
Swing traders looking for a structured system.
Backtesters who need clean, rule-based logic with visible risk management.
Users can fine-tune the entry timing, SAR sensitivity, and risk-reward ratio to fit their trading style.
Final Thoughts
The Parabolic SAR strategy with ATR-based exits is a robust, rule-driven approach to trend trading. It avoids emotional decisions, adapts to market conditions, and maintains clear visual logic. Whether you're building your first algorithm or refining an existing edge, this setup provides a flexible and well-tested foundation.
177# Closed Daily Candles Trading System
Submit by Janus Trader
Trade Entry Rules - All Using Closed Daily Candles:
• A correct candle (Bull candle for a potential Buy, Bear candle for a potential Sell has closed over the
Kijun-Sen and over the correct 25,1 Envelope outer by at least 10 pips net of spread.
• The 0.0115, 0.115 PSAR is below the price action for a Buy, above for a Sell AND
• The Aroon 14 is showing a correct colour line at 100% AND
When All That Is In Place:
• Set a trade stop entry 51 pips (Add spread as required) beyond the high (for a buy) or low (for a sell) for
the GBPUSD pair (54 pips for the EURUSD and USDCHF)
• Set a contingent limit exit 100 pips gross (Less spread as required) beyond the trade entry point for half
of the trade (you may need to place two simultaneous trades for this - one to exit at 100 pips profit and
one with an indeterminate exit)
• Set a contingent stop loss at 10 pips (Add spread as required) behind the 20 SMA
After reading this entire section thoroughly see the graphics at the bottom of this page.
Removing Trades:
If a Sell trade has been placed and remains unopened (Not yet triggered) when a daily candle closes
above the Kijun Sen remove the trade. If a Buy trade has been placed and remains unopened (Not yet
triggered) when a daily candle closes below the Kijun Sen remove the trade.
Trade Exit Rules:
• The initial exit point for the first part of the trade is at 100 pips (Less spread as required) which has
already been set as a limit exit
• The second part of the trade is allowed to carry on to reversal.
Closing The 2nd Part Of The Trade:
• Once the first exit has been achieved, bring the stop loss up to 100 pips gross (Less spread as required)
behind the original entry value for the second portion, ensuring a break even trade at worst (if both
portions of the trade are of equal size)
Continuation Trades:
A new trade or continuation trade cannot be placed unless a daily candle has first closed over the Kijun Sen, therefore if a Sell trade closes a new Sell trade cannot be placed until a daily candle has first closed above the Kijun Sen.
Risk Management:
You'll notice as you follow the trades that the opening stop losses, before the first 100 pip gross profit is reached, can be sizeable - over 300 pips in certain cases. You have to assume that a sizeable opening loss will occur at some point, so you must use a trading bank that can withstand a 300 pip loss at some point. I don't like having double percentage point losses, so a 2000 point bank is my preference, but you may want to be either side of that.
Bear in mind that's 2000 points for BOTH portions of the trade, meaning effectively a 4000 point bank foreach as they are traded simultaneously.
Once a trade is under way, DON'T be tempted to intervene as you will virtually always get it wrong. This is end of day, not intraday, trading and different thought processes are needed. Go purely by the indicators and only use closed candles when taking decisions. Move your trailing stop loss daily 10 pips net (Add spread as required) above the closed value of the 20 SMA for a Sell trade and 10 pips below the 20 SMA for a Buy trade.
Finally, try and take any decisions as close as you can to midnight GMT as that is when the candles close. Whilst it's rare for the Far East action to have much effect, it's worth making the extra effort when you're getting near a potential trade point.
Note of Caution:
Reduce (1/2 possibly) staking when a currency pair is reaching new highs or low as added volatility at these levels should be expected. When trading GBPUSD either trade cautiously or ignore trades where your 1st exit profit is above 2.0000 or below 1.5000.
FAQs:
When do I start to use the SMA to move the stop loss?
Adjust the stop loss daily whether the trade is pending or active. Once the 1st part of the trade closes move the SL to 100 (Add spread) behind the entry, continue to check your trade daily, when the SMA trailing stop offers a SL less than 100 pips behind the entry value adjust the SL daily.
What currencies can I trade?
We have detailed the set ups required for GBPUSD, EURUSD and USDCHF, but it is so easy to back test this system why not look at alternatives such as GBPJPY.
Please explain which line signifies Up and which line signifies Down in the Aroon indicator?
The blue line is the Aroon Down and the yellow line is the Aroon Up.
Daily Forex Strategies
21# 100 pips daily - Forex Strategies - Forex Resources - Forex ...
11# Daily Breakout - Forex Strategies - Forex Resources - Forex ...
daily 20 pips - Forex Strategies - Forex Resources - Forex ...
18# 95 pips daily - Forex Strategies - Forex Resources - Forex ...
177# Closed Daily Candles - Forex Strategies - Forex Resources ...
24# Trading Scalping on the Daily Bar - Forex Strategies - Forex ...
52# Daily FX - Forex Strategies - Forex Resources - Forex Trading
175# 10 pips - Forex Strategies - Forex Resources - Forex Trading
194# Daily Scalping - Forex Strategies - Forex Resources - Forex
213# Daily Forex Signal - Forex Strategies - Forex Resources ...
267# Daily Smart - Forex Strategies - Forex Resources - Forex ...
3 Metatrader Daily Pivot and Cam Pivot - Forex Strategies - Forex ...
