SuperTrend & StochRSI Trading Strategy: A Powerful Combination - Forex Strategies - Forex Resources - Forex Trading-free forex trading signals and FX Forecast
109# SuperTrend & StochRSI Trading Strategy: A Powerful Combination
Submit by Dimitri 2025
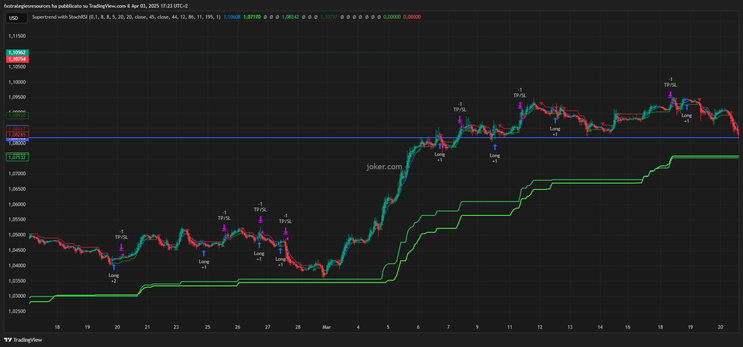
SuperTrend & StochRSI Trading Strategy: combining trend-following indicators with momentum oscillators can lead to highly effective trading strategies. One such approach is the combination of SuperTrend and Stochastic RSI (StochRSI). This strategy aims to capture high-probability trading opportunities by aligning market trends with overbought and oversold conditions. In this article, we will explore the logic behind the strategy, its rules, and how it can be implemented in trading.
Understanding the Indicators
1. SuperTrend Indicator
The SuperTrend indicator is a trend-following tool that provides buy and sell signals based on volatility. This strategy utilizes three different SuperTrend settings:
-
Fast SuperTrend: (10-period, factor 1)
-
Medium SuperTrend: (11-period, factor 2)
-
Slow SuperTrend: (12-period, factor 3)
The medium SuperTrend line serves as the stop-loss level and a key confirmation factor for entries.
2. Stochastic RSI (StochRSI) - Buy & Sell Signals Only
StochRSI is an oscillator that identifies overbought and oversold conditions, triggering buy and sell signals:
-
A StochRSI cross above 20 generates a Buy signal.
-
A StochRSI cross below 80 generates a Sell signal.
Trading Rules
Long Trade (Buy) Criteria:
-
StochRSI generates a Buy signal (cross above 20).
-
The medium SuperTrend line is below the closing price.
-
Stop-loss is placed at the medium SuperTrend line.
-
Take-profit is set at 1:1 to 1:1.2 times the stop-loss distance.
Short Trade (Sell) Criteria:
-
StochRSI generates a Sell signal (cross below 80).
-
The medium SuperTrend line is above the closing price.
-
Stop-loss is placed at the medium SuperTrend line.
-
Take-profit is set at 1.5 times the stop-loss distance.
Implementation & Backtesting
This strategy can be implemented in TradingView using Pine Script, allowing for automated backtesting and optimization. Traders may fine-tune the SuperTrend and StochRSI settings to better suit different market conditions and asset classes.
Conclusion
The combination of SuperTrend and StochRSI provides a structured approach to trading, filtering trades based on trend direction and momentum shifts. While no strategy guarantees success, proper risk management and parameter optimization can enhance profitability. Consider backtesting and paper trading before applying it to live markets.
109# Contrarian Trading System
Time Frame H1 or higher
Pairs: GBP/USD, EUR/JPY, GBP/JP, AUD/JPY, GPB/CHF, USD/CAD
Indicators:
Stochastic over BS
Squidster
Bolliger Bands (20, 3)
Long Entry
StochsOverBS - red or pale red.
A red arrow
Short Entry
StochsOverBS - green or pale green.
A red arrow.
Exit Position:
Stop Loss for buy 5 pips below lower band;
Stop Loss for Sell 5 pips above upper band.
Profit Target on middle band or opposite band,
or entry with Two order first target on middle band, second target on opposite band.
Forex Contrarian Trading System: Template and indicators MT4
133# 1 min Contrarian Scalping (VIII) - Forex Strategies - Forex ...
109# Contrarian - Forex Strategies - Forex Resources - Forex ...
153# Dynamic Channel, Contrarian Strategy. - Forex Strategies ...
346# Fx Contrarian - Forex Strategies - Forex Resources - Forex ...
150# Contrarian Scalping - Forex Strategies - Forex Resources ...
Contrarian with HMA and Bollinger bands
300# HMA and SMI - Forex Strategies - Forex Resources - Forex ...
124# Swing Extreme - Forex Strategies - Forex Resources - Forex
325# Past Regression Deviated Method - Forex Strategies - Forex
12# Renko with DTOSC and Past Regression Deviated - Forex ...
2# Renko with I-Regression bands - Forex Strategies - Forex ...
123# ATR Channels Strategy - Forex Strategies - Forex Resources
 La mia ditta


