 La mia ditta
DayTrading Master - Forex Strategies - Forex Resources - Forex Trading-free forex trading signals and FX Forecast
170# DayTrading Master
Trend Following Strategy For Day Trading
Day Trading Indicators
Submit by Dimitri
DayTrading Master is a trend following strategy for day trading it's based on trend Day trading Master Indicator.
This indicator has the following features:
Features of this indicator:
-
All trades have at least 1:2.5 risk reward and up to 1:6.
-
Small stops on all trades
-
High winning ratio when used with the right filtering indicator (ChartCycles is included)
First Step Install the indicator in your MT4, Check the reference page for detailed installation. As a quick reference: Add the Daytrade Master indicator and ChartCycles indicator to the indicators folder and the Daytrade template to the templates folder under File/Open Data Folder/templates in Metatrader.
Second Step apply the template Daytrade Master to your MT4 charts.
Third Step take trades with proper money management, that is don’t gamble your money and trade properly, remember if you make just 3% per day, you will double your account in a month when you compound the profits.
Entry Setup
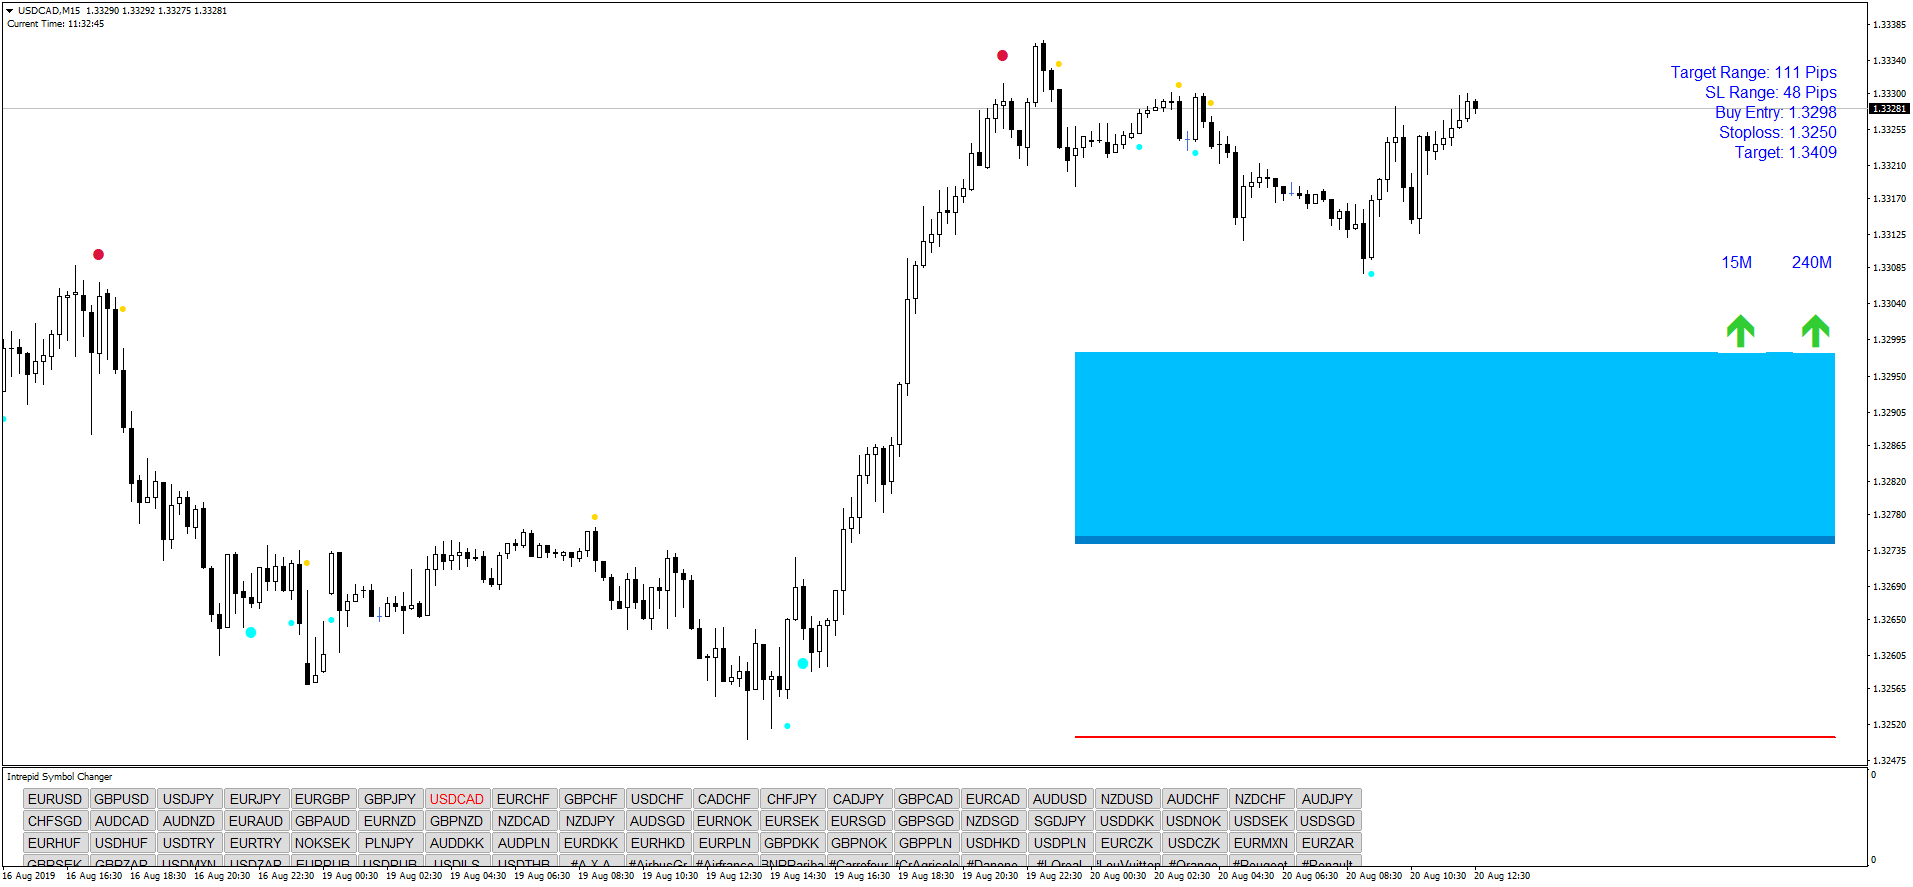
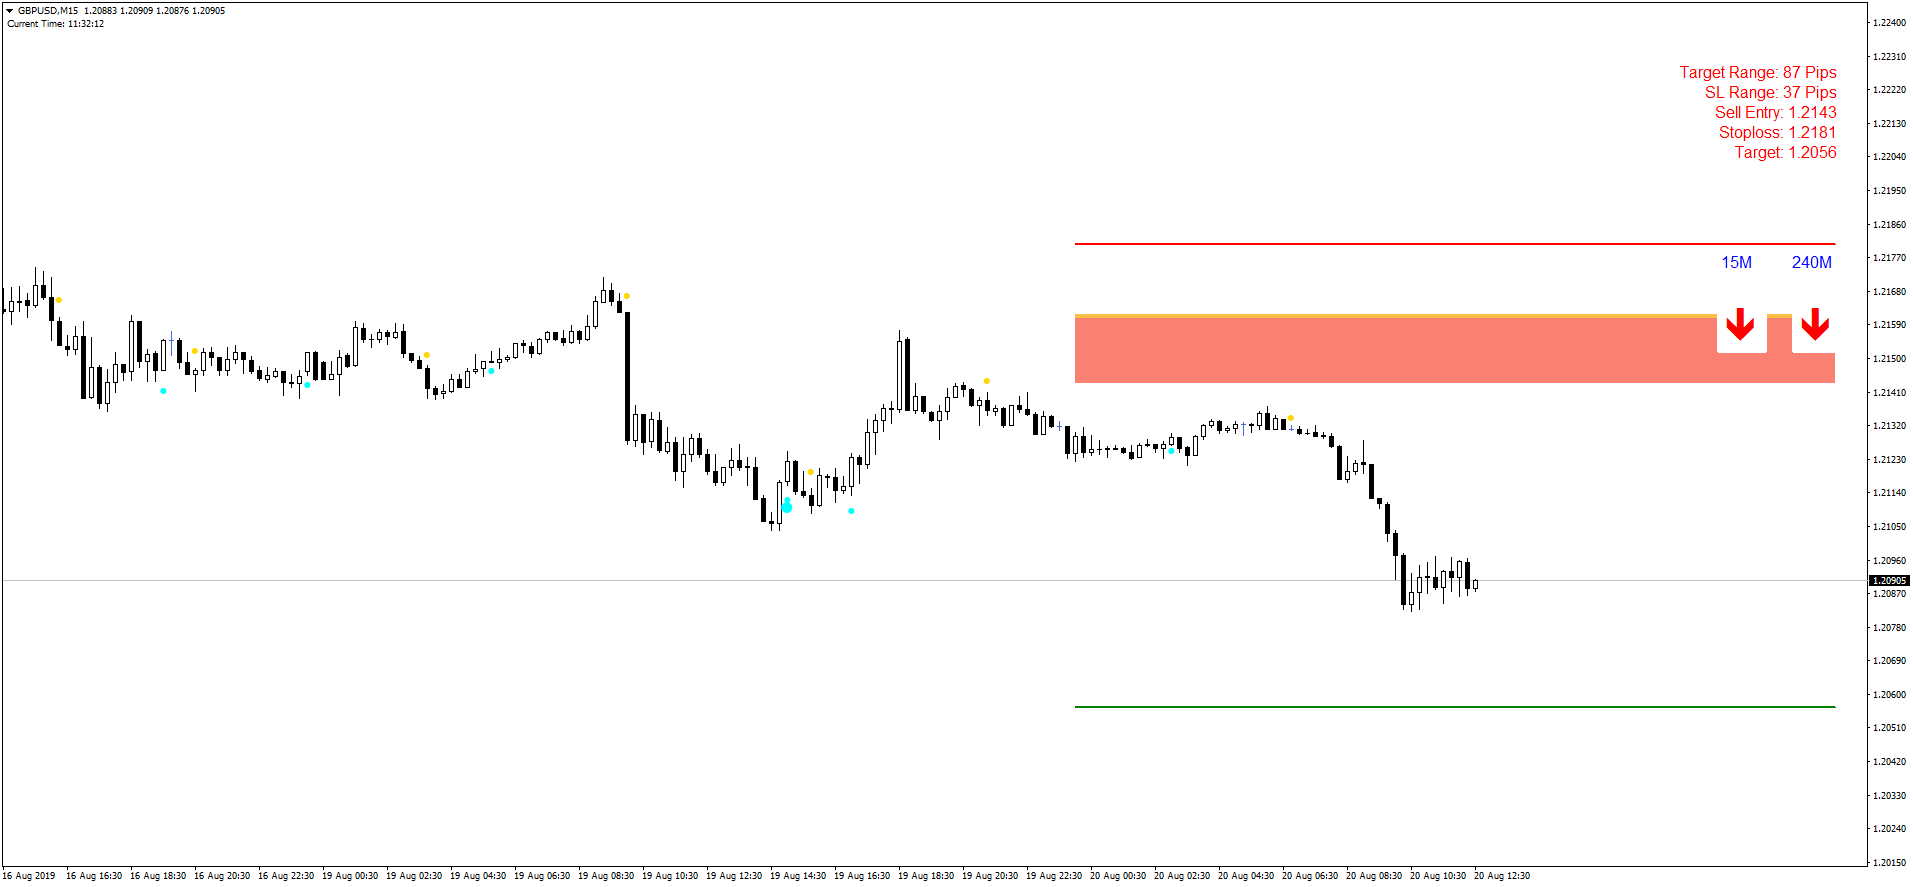
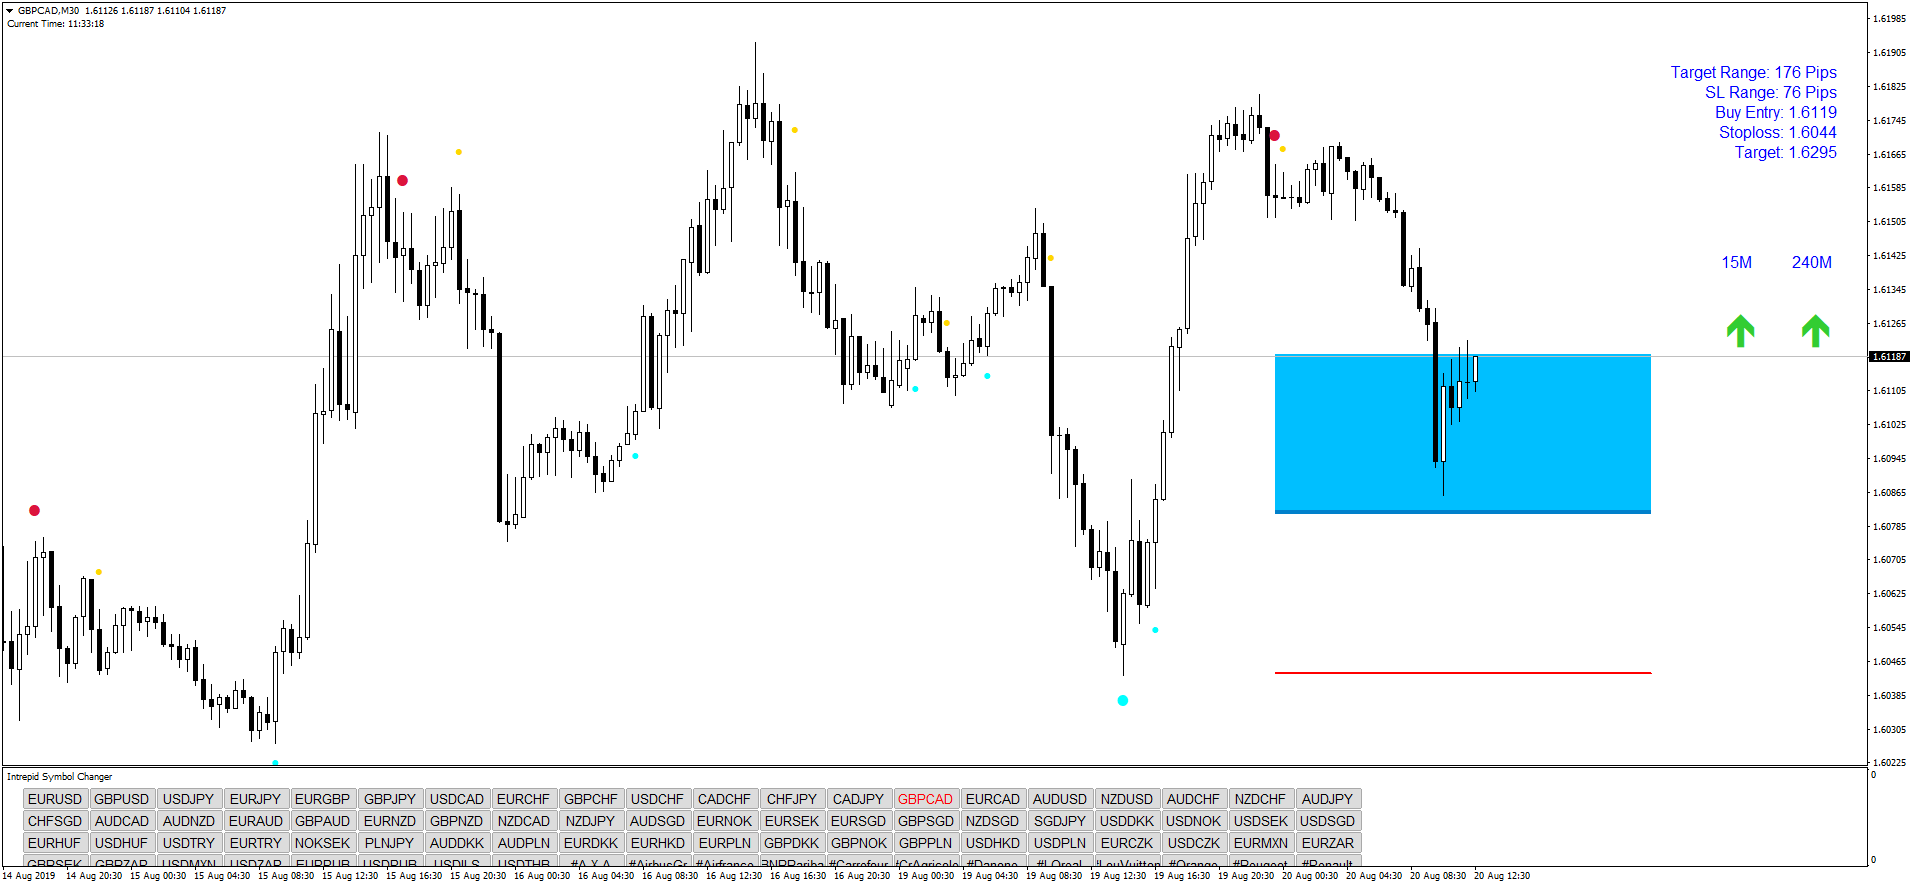
Now the trades are very simple to find. There is one setup you need to find. This setup consists of a blue dot in a blue box for Buy entries and a red dot in a red box for Sell entries.
Use the 15 M or 30M time frame with the ChartCycles indicator to find daytrading opportunities.
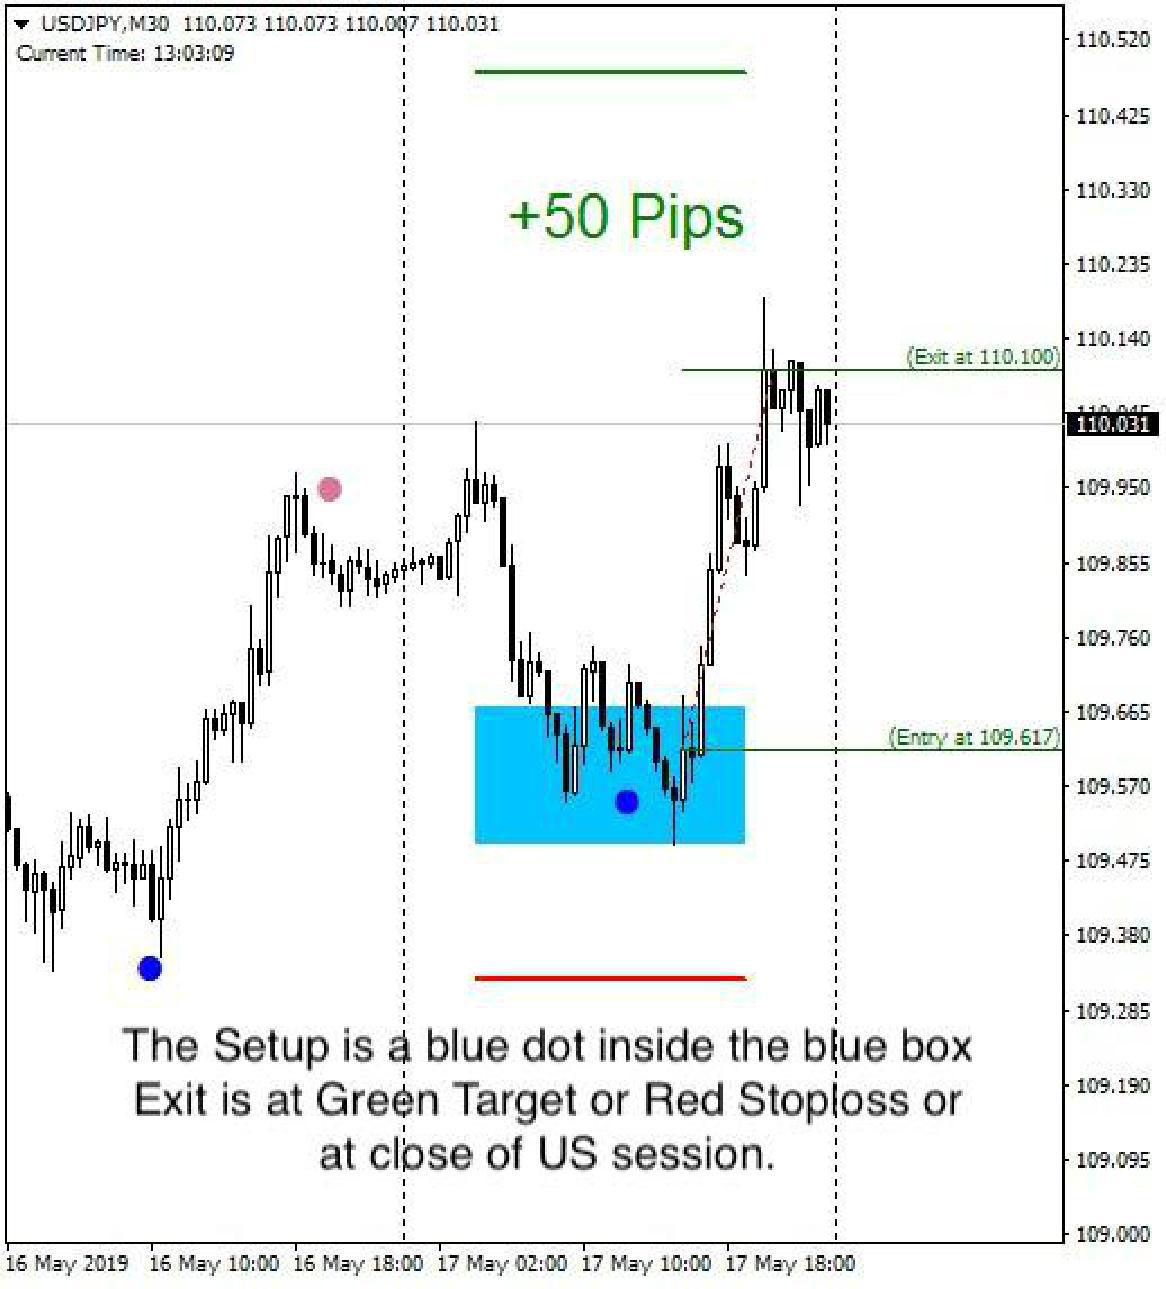
Buy Entry: Blue dot in Blue box.
If the blue dot is before the formation of the blue box, then ignore the signal. The best signals are when the blue dot is inside the blue box and the same for the red dot inside the red box for sell signals.
The DTM will plot the boxes automatically according to the short term trend in the market. A red box means look only for Selling opportunities. A blue box means look only for buy opportunities.
Exits
To exit a trade there are 3 simple exits:
Exit at Green line target
Exit at Red line stoploss
Exit at end of US session if none of the stoploss or target has been hit.
Exit if a reverse dot appears.
Money Management
Make sure to never risk more than 2-3% of your trading capital on any single trade. To increase your chances of making more profit try to enter as close to the bottom of the blue box as possible. If you enter at the top of the box the Risk:Reward ratio is 1:2.5 and if you enter at the bottom of the box the Risk:Reward ration is 1:5.7. This is a very important information cause it means if you enter at the top of the box you can win 3/10 trades and breakeven, and if you enter at the bottom of the box you can win 2/10 trades and breakeven. If you follow the simple trading rules above you should win over 8/10 trades. Its simply a blue dot in a blue box to enter a trade.
In the pictures Day Trading Master in action.
download link
update 15/10/2019
https://drive.google.com/open?id=1Keoweri_QVsS6OIpAv6ZBSue8zXlQKGw
Share your opinion.
velmurugan (Wednesday, 14 February 2024 13:56)
i want above the indicator
Tono (Sunday, 10 October 2021 05:59)
plese send email winvada@gmail.com
Axeas (Thursday, 28 January 2021 10:13)
Please where is the link to download the file?
Thanks in advance
Axeas
Alex (Wednesday, 19 February 2020 15:13)
DTM indicator is not set on the chart, therefore there are no blue and red zones.
sergio (Friday, 06 December 2019)
no encuentro el indicador podrian enviar x correo sergiofromero@gmail.com
gracias
moses (Tuesday, 19 November 2019)
Thank you
Gregor (Tuesday, 15 October 2019 14:47)
As a typical cycle indicator, it recalculate or draws a signal in the past. Just use strategy tester to become aware of such dangerous indicators. As always: try before you fly!
Kamo (Tuesday, 15 October 2019 13:14)
Looks good. Are any of the indicators repainting or recalculating? Someone tested it in strategy tester or in live mode? Thanks1
guigui (Monday, 30 September 2019 15:51)
指标在哪里?请把指标发送到215803212@qq.com
谢谢。。
guigui (Monday, 30 September 2019 15:41)
where's indicator?plese send email 215803212@qq.com
thanks..
Mango (Saturday, 21 September 2019 23:15)
Not repaint. this is a very good system.
Berti (Saturday, 21 September 2019 16:34)
Hi, dear Dimitri.
Thank you